
How to Track Instagram Follower Growth History
A clean daily follower log separates noise from meaningful Instagram growth so you can act on real trends.
A clean daily follower log separates noise from meaningful Instagram growth so you can act on real trends.
4.98 /5 - from 58k reviews
Trusted by 50,000+ creators — get real engagement delivered to your profile in minutes, not days.
Your follower count means almost nothing without history. I can track Instagram growth by logging the same numbers each day, setting a 14–30 day baseline, and checking for spikes, drops, and churn against that baseline.
Here’s the short version:
A simple example: if an account moves from 10,000 followers to 10,250, that’s 2.5% growth. If the next month goes from 10,250 to 10,400, growth is still positive, but the rate slips to about 1.5%. That tells me momentum slowed, even though the account still grew.
The main point is simple: I need a clean daily record so I can tell normal fluctuation from a pattern I should act on. The article explains how to set up that record, read the charts, and use tools like UpGrow to monitor changes as they happen.
Before you touch a dashboard, set up a simple daily log. That log is your control point. Without it, day-to-day comparisons get messy fast.
Start with five fields every time you record data:
Keep the format the same each time. Use U.S. date and time style, like 09/03/2026 and 9:00 AM, so everyone on the team reads the data the same way. Write follower counts with commas, such as 12,475. For net follower change, use the difference from the last entry. If you went from 12,475 to 12,610, that entry should show +135.
If your analytics tool includes it, add follower losses as a separate field. That extra line matters more than it seems. A day with 200 new followers and 180 losses tells a very different story than a clean +200.
Use context notes to explain what was happening that day. Maybe you ran a paid ad campaign. Maybe you launched a giveaway, dropped a new product, or had a Reel take off. Those notes help later when you look back at spikes and dips and try to figure out what caused them.
Log data once a day at the same time. During campaigns, check in more often - about 2 to 4 times per day. Weekly logging can work for smaller accounts, but daily should be the default.
Once your log is steady, the dashboard can start showing patterns instead of noise.
Your baseline is your version of normal. It shows what follower growth looks like when nothing unusual is going on.
To build it, collect at least 14 to 30 days of steady daily data. Then calculate your average daily net follower change with this formula:
average daily net follower change = total net change ÷ number of days
After that, map your usual daily range - the low end and high end of your daily changes during that same period. That range gives you a quick gut check. If a day lands far above your baseline, it's worth a closer look. The same goes for a negative day that drops well below your normal range.
That baseline helps you label later growth for what it is: normal, strong, or weak.
Use it as the reference point for your dashboards and date-range comparisons.
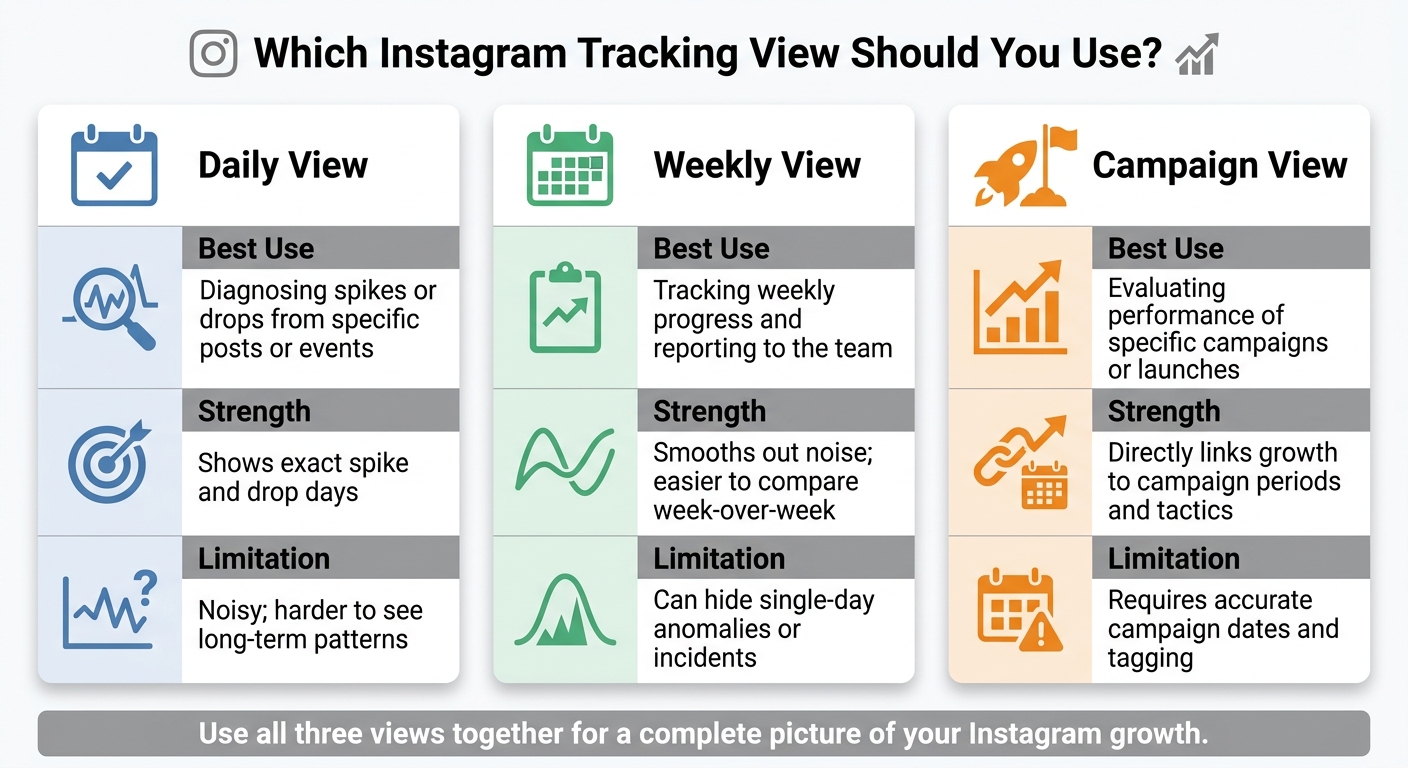
Instagram Follower Tracking: Daily vs. Weekly vs. Campaign Views
Once your baseline is in place, turn your daily log into dashboards you can scan fast and share with the team. The key is simple: use that baseline as the comparison layer in every dashboard view.
Use three dashboard views.
A time-series line chart should show total followers by day across the last 30 to 90 days, or by week if you're looking at a longer window. This gives you the main trend at a glance.
Then add a daily net change bar chart by day or week. This matters more than it may seem. A total-follower line can look flat even when people are following and unfollowing in the background. The bar chart brings that churn into view.
Finally, add summary tiles for:
If you're a brand or agency managing more than one account, add an account selector and a summary table with each profile's current followers, 30-day growth, and growth rate. That gives you a quick read on which accounts need attention.
If your tool allows it, use campaign filters to isolate growth during set periods like a product launch, giveaway, or paid push. That way, campaign performance doesn't blur your normal growth line.
Then use date-range presets to separate routine growth from campaign-driven swings.
The most useful date-range presets are Last 7 Days, Last 30 Days, Month-to-Date (MTD), and custom ranges tied to campaign start and end dates.
Here's the simple breakdown: Last 7 Days works well for recent campaign checks, Last 30 Days is better for trend tracking, MTD fits team reporting, and custom ranges are best for campaign review.
When possible, turn on a compare-to toggle that pulls the matching prior period. Seeing the current range next to the prior one makes it much easier to tell if growth is moving up or starting to slip.
For exports, run a weekly CSV export with:
Use a consistent file name by account and month. It sounds minor, but it saves a lot of digging later.
For team reporting, export a monthly PDF snapshot with your time-series chart, net-growth bars, and summary tiles. Agencies can save a lot of time by scheduling email delivery of these snapshots instead of building them by hand every month.
Those exports help you see whether a spike was just a one-off bump or the start of a pattern.
Use daily, weekly, and campaign views for different decisions:
| View | Best Use | Strength | Limitation |
|---|---|---|---|
| Daily View | Diagnosing spikes or drops from specific posts or events | Shows exact spike and drop days | Noisy; harder to see long-term patterns |
| Weekly View | Tracking weekly progress and reporting to the team | Smooths out noise; easier to compare week-over-week | Can hide single-day anomalies or incidents |
| Campaign View | Evaluating performance of specific campaigns or launches | Directly links growth to campaign periods and tactics | Requires accurate campaign dates and tagging |
Once your dashboard is live, the next job is to read the pattern, not just stare at a single number. A snapshot can fool you. Your baseline and dashboard help you sort normal movement from a change that means something.
Every follower chart has some noise. On smaller accounts, especially those under 10,000 followers, day-to-day swings can look dramatic when you view them on their own. That's why weekly totals and rolling averages give you a better read on direction.
A real trend stays above or below your baseline for several weeks and lines up with a clear shift in strategy, posting, or campaigns. One bad day isn't enough. But three to four weeks of falling weekly averages usually is.
To put a number on it, use the standard growth rate formula: ((Ending followers – Starting followers) ÷ Starting followers) × 100. Say you start a month at 10,000 followers and end at 10,250. Your growth rate is 2.5%. If the next month you go from 10,250 to 10,400, that's 1.5%. You're still growing, but the rate has slowed by almost half. That kind of slowdown matters, even when the total follower count is still going up.
Treat flat or negative monthly growth as a warning sign.
Once you can spot a trend, the next step is tying it back to the posts and campaigns that may have caused it.
After you notice a spike or a drop, match it to what you posted or launched that day. Keep a simple activity log next to your follower data with:
Then compare that log with your growth chart.
For example, if you see a two-day follower jump and it lines up with a collaboration Reel, that's a strong clue that the collaboration helped drive growth. If you see that same pattern happen a few times, it stops looking like luck and starts looking like a repeatable play.
Drops work the same way. If a -150 follower dip lines up with back-to-back promotional posts or a gap in posting, that's probably your clue. Pick one likely cause, change one variable, and measure again.
Daily tracking works best when you want to pinpoint which post caused a spike. Weekly tracking is the best default for most accounts because it smooths out noise but still lets you catch real movement. Monthly tracking shows whether your overall growth approach is working over time.
Once you understand past follower trends, the next step is watching for the next change while it’s happening. After you map historical patterns, AI tools help you monitor them in real time by collecting data automatically around the clock. That keeps your growth history complete, even when you’re not checking in yourself.
AI tracking adds always-on monitoring to your workflow. Instead of logging one daily snapshot by hand, the system tracks follower counts, reach, impressions, and profile visits in real time or at set intervals. So if a Reel blows up overnight, or a wave of unfollows hits on a Sunday afternoon, that data is already there by the time you open your dashboard on Monday morning.
This also helps with anomaly detection. If your account usually gains 20–30 followers a day and suddenly jumps by 300 in a few hours, an AI system can flag that change and send an alert. The same goes for losses: if follower count drops by 5% in 24 hours, you can get a notice right away instead of finding it days later during a manual check. That speed matters. It gives you a chance to respond to a trend while it still matters instead of spotting it after the moment has passed.
UpGrow puts this workflow into practice with live monitoring and real-time reporting. UpGrow is an AI-powered Instagram growth service that combines organic follower growth with a live analytics dashboard built for real-time monitoring. The platform tracks follower counts, engagement metrics, and growth trends nonstop, with 24/7 monitoring running in the background.
UpGrow’s analytics break down growth by audience demographics, including age, gender, and location. That makes it easier to connect follower changes to specific content choices and targeting moves. The Boost™ tool can help speed up growth during key windows, like a product launch or seasonal promotion. You can then use the dashboard to see whether Boost™ changed net follower gain over the next 48 hours. Live exports tied to campaign tags also let you pull performance data without rebuilding reports by hand.
A smart way to make the switch is to run manual tracking and AI tracking side by side for a few weeks. That gives you time to check that the AI log lines up with your baseline before you rely on it fully.
Once your dashboard and exports are set up, check the data on a fixed schedule. Look at it weekly to spot spikes and drops. Then review it monthly to see the direction of the trend and how retention is holding up.
Follower count by itself doesn't tell the full story. Growth rate matters more because it shows both speed and direction.
When you spot a spike or drop, don't jump to conclusions. Compare it against your baseline and your content calendar first. That's how you label what happened with some confidence. A product launch, a shift in posting cadence, or a campaign will usually leave clear signals in the data if you've been tracking it the same way each time.
Scale the content that keeps driving net growth. Cut the content that keeps leading to unfollows.
The goal is simple: build a clear, consistent record so you can make faster, smarter decisions about content, timing, and growth strategy week after week.
Track followers long enough to spot real trends, not just short-term swings. Instagram’s built-in analytics often keep data for only 30 to 90 days, and some metrics need 48 to 72 hours to settle. So if you only look at a small snapshot, the picture can get distorted.
A steady, long-term approach tends to work best. Review your growth reports each month to spot patterns, fine-tune your strategy, and make sure growth stays steady over time.
Net growth is your follower balance over a set period: new followers gained minus followers lost. It shows if your audience is growing overall.
Follower churn is the number of followers you lose. Tracking it helps you see when and why people leave, so you can adjust your content, messaging, or audience fit.
Use manual tracking, like a spreadsheet, when you want a personal record that ties specific campaigns or pieces of content to follower growth over time. It works best when you want custom logs and a long-term history that goes past the 90-day limit in native tools.
Use AI tracking when you need live monitoring, automated data collection, and fast insights without typing everything in by hand. It’s best for spotting momentum shifts and adjusting your growth strategy as changes happen.


