Instagram Time Zone Scheduling: Guide 2026
Schedule posts for your audience’s local time, test 3 daily windows, track reach and watch time, and refine your calendar weekly.
Schedule posts for your audience’s local time, test 3 daily windows, track reach and watch time, and refine your calendar weekly.
4.98 /5 - from 58k reviews
Trusted by 50,000+ creators — get real engagement delivered to your profile in minutes, not days.

If I post at the wrong hour, even strong Instagram content can stall. The fix is simple: I schedule posts for my audience’s local time, not mine, then test each slot for 2 weeks and keep the ones that bring the best reach, saves, shares, watch time, and follows.
Here’s the short version:
A simple example: if my best slot is 9:00 AM ET, that means 8:00 AM CT, 7:00 AM MT, and 6:00 AM PT. That one shift can change who sees the post in its first hour.
| Format | Best starting windows | Main metrics |
|---|---|---|
| Feed posts | 7:00–9:00 AM, 11:00 AM–1:00 PM, 6:00–9:00 PM | Reach, saves, shares |
| Reels | 9:00–11:00 AM, 6:00–8:00 PM | Watch time, completion, follows |
| Stories | 10:00 AM–12:00 PM, 7:00–9:00 PM | Exits, replies, sticker taps |
The main point: I don’t use generic “best time to post” charts as my schedule. I use my own audience data, test a small set of time slots, and update the calendar as follower locations shift.
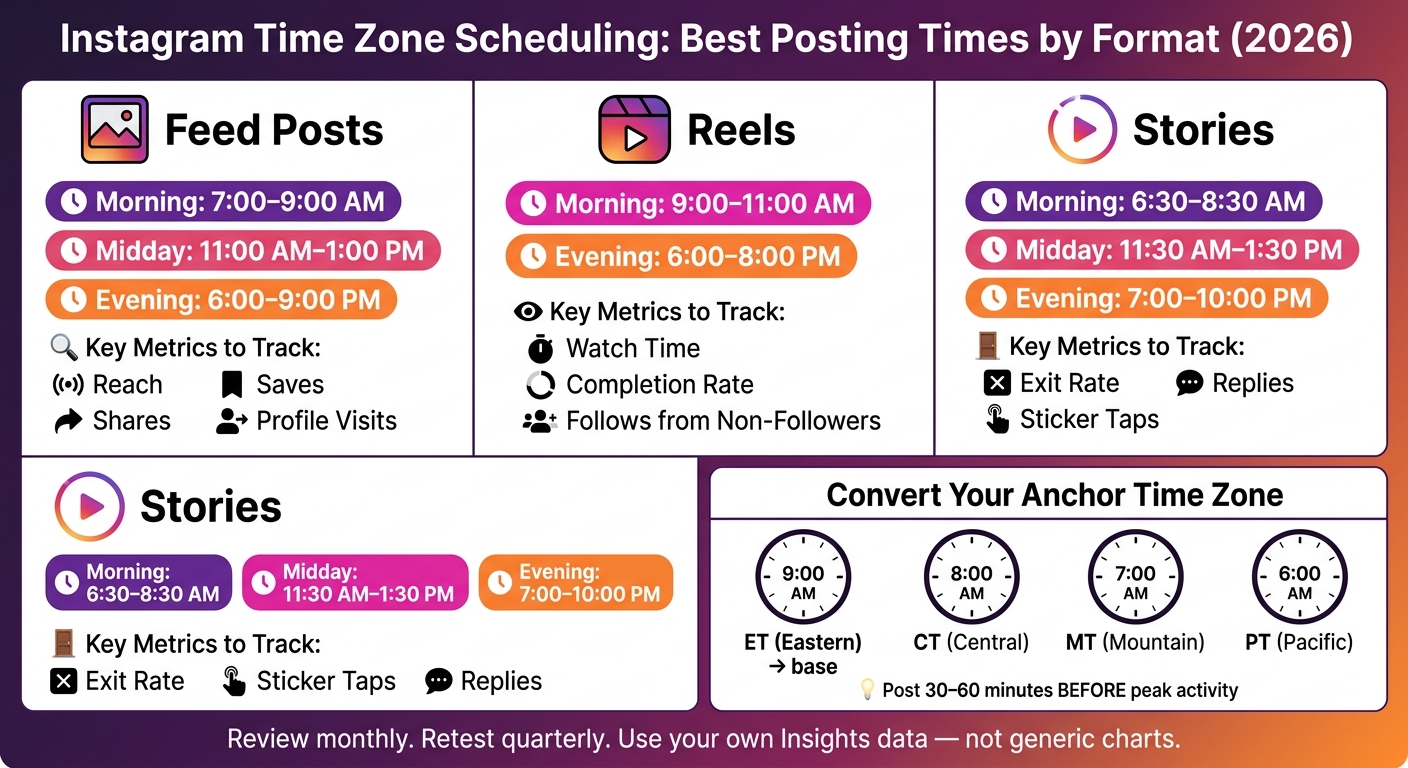
Instagram Posting Times by Format & Time Zone (2026)
Start by turning those activity spikes into simple time-zone groups.
Open Professional Dashboard → Account Insights → Audience. There, you’ll see Top Locations and Most Active Times. Top Locations shows the cities and countries where most of your followers are based. Most Active Times shows when they’re active by hour and by day.
Before you use that data, make sure Instagram is showing hours in the right time zone. In most cases, Most Active Times follows your device’s time zone. So if your phone is set to Eastern Time, the activity bars will show ET. If you traveled recently or changed your phone settings, those hours can shift. Set Date & Time to automatic, then reopen Insights.
Once that’s set, connect the chart to where your followers actually live.
Take your top cities and countries and match each one to its local time zone. New York is ET. Chicago and Dallas are CT. Denver is MT. Los Angeles is PT. London is GMT/BST. Sydney is AEST.
From there, group those places into simple regional clusters. Then pick the biggest cluster as your anchor time zone. If most of your audience is on the East Coast, use ET. If the Midwest leads, use CT. If your top cities lean West Coast, use PT. After that, convert each posting time from that anchor.
Next, check your Most Active Times chart and look for the hours where the bars stay tallest across the week. A good starting point is to test three windows in your audience’s local time:
Pick two or three of those windows to begin with.
Post 30–60 minutes before the peak so your content is already live when followers start showing up.
Then lay everything out in a simple weekly content calendar. A spreadsheet is enough. Include:
For example, a 9:00 AM ET post goes live at 6:00 AM PT, 2:00 PM in London, and 10:00 PM in Singapore.
Run this Monday through Friday using all three windows. On weekends, test the two time slots that performed best.
Use those starting windows for feed posts, Reels, and Stories next.
Start with your anchor time zone. Then tweak your schedule by format. Each format behaves a bit differently, so it makes sense to time them differently too.
Feed posts mostly appear in followers' home feeds. That means you're working with fairly steady daily habits. Good starting windows are 7:00–9:00 AM for the morning scroll before work or school, 11:00 AM–1:00 PM for lunch breaks, and 6:00–9:00 PM for after-work downtime.
If your audience is spread across more than one time zone, convert those windows from your anchor time zone. If one time zone clearly leads, schedule for that zone first. Then test secondary zones after two weeks.
Reels are a different game because discovery matters more than routine.
With Reels, the goal is to hit overlapping active hours. Good test windows are 9:00–11:00 AM and 6:00–8:00 PM in your anchor time zone.
| Viewer Behavior | U.S. Window (ET) | Notes |
|---|---|---|
| Morning commute scroll | 7:00–9:00 AM ET | Strong for U.S. discovery |
| Lunch break scroll | 12:00–1:00 PM ET | Midday engagement window |
| Evening couch time | 9:00–10:00 PM ET | Late-day reach |
Watch plays, watch time, and follows from non-followers. Those numbers tell you whether a Reels slot is helping you reach new people or just getting more views from the same audience.
Stories lean much more on habit, so posting on a steady rhythm beats chasing a single peak hour.
Stories mostly reach existing followers, so consistency matters more than discovery. View-through rates are strongest at 10:00 AM–12:00 PM and 7:00–9:00 PM in the audience's local time.
A simple daily setup that fits those patterns looks like this:
Use repeatable daily blocks instead of random uploads.
| Story Block | Best Local Time | Content Type | Engagement Signal to Watch |
|---|---|---|---|
| Morning | 6:30–8:30 AM | Updates, behind-the-scenes | Forward taps, exits |
| Midday | 11:30 AM–1:30 PM | Polls, product highlights | Sticker interactions |
| Evening | 7:00–10:00 PM | Q&As, recaps, quizzes | Replies, quiz answers |
Once your format-specific slots are live, compare them against your test slots. This is where your starting schedule stops being a guess and starts reflecting what your audience actually does.
Use the anchor time zone and format windows you set above as your baseline test schedule. Pick 3–5 slots for each primary time-zone cluster. Then assign each slot to set days and content formats, and run that setup for two weeks.
The key here is control. Post comparable content on comparable days so timing is the main thing changing. For example, publish educational carousel posts on Mondays and product-focused Reels on Wednesdays. That way, if one slot does better than another, there's a better chance the lift came from when you posted, not what you posted.
Try to keep these factors as consistent as possible:
That makes your test cleaner and easier to read.
Likes don't tell the whole story. Put more weight on reach, impressions, engagement rate, saves, shares, and profile visits. If traffic is part of the goal, also track website taps or product page clicks.
Some signals matter more than others. Saves, shares, profile visits, watch time, and follows usually tell you more than likes.
For Reels, pay close attention to average watch time, completion rate, and follows gained from each Reel. Those numbers show whether a slot is helping you get in front of new people.
For Stories, focus on exit rates and sticker taps. Low exits and high taps usually mean the timing lines up well with your audience's day-to-day habits.
Audiences shift over time, and your schedule needs to move with them. Review follower location data at least once a month. If a new region starts growing, adjust your anchor time zone and retest your top slots using the same primary and secondary clusters you set earlier.
Run another test every quarter, or sooner if you see a clear drop in reach or engagement. Seasonal changes matter too. Summer and back-to-school periods, for example, can change when people are most active, so it's smart to check your slots after major behavior shifts.
Once the top slots stand out, add them to your content calendar and scale the workflow.
Once your test slots are in place, use UpGrow to figure out which regions should get top priority in your calendar. UpGrow's AI-powered targeting filters let you sort by location, language, age, gender, and profile-quality signals. That makes it easier to check which regions drive the strongest engagement from followers who are most likely to engage or buy.
After you set those priority regions, use the live dashboard to make sure they're still pulling stronger engagement. This step matters because a region may look good at first, then level off later.
UpGrow's real-time dashboard helps you check what's working right now. You can track audience fit, engagement trends, and regional performance across feed posts, Reels, and Stories week over week.
Use both data sources side by side:
If a new region starts driving stronger engagement, treat that as your sign to retest your anchor time zone and update the calendar.
Start by scheduling based on your audience's local time. Then keep refining the calendar as regional performance shifts. Track reach, engagement, watch time, and conversions to make sure each slot is doing its job.
Time-zone scheduling works best when you treat it as a weekly review-and-adjust system.
If your followers are spread across multiple time zones, posting at just one time can cut into reach and lead to fewer interactions. Check the Most Active Times heatmap in your Professional Dashboard to spot when your audience is online.
If most of your audience is in two main regions, aim for at least two posts per day. If your audience is global, post three times daily and use a UTC calendar to keep your schedule steady. UpGrow can help automate this based on follower activity and time zone spread.
Test each posting time for 4 to 6 weeks and keep content quality steady. Rotate your posting times, then compare metrics like reach, saves, and completion rates to find patterns in how your audience behaves.
Follower habits can shift over time, so review your posting windows every few months and adjust them as needed to keep performance strong.
Change your anchor time zone when your audience mix shifts or user behavior changes, like during seasonal trends or Daylight Saving Time.
Engagement can drop by 31% if you ignore your audience’s main region. So post for your audience’s time zone, not your team’s. If your audience is split across regions, tools like UpGrow can help you track engagement and fine-tune posting times as follower habits change.