Instagram Profile Benchmarking: Metrics to Compare
Compare Instagram profiles over a 30–90 day window to assess visuals, bio/link setup, content mix, engagement, cadence, and follower quality.
Compare Instagram profiles over a 30–90 day window to assess visuals, bio/link setup, content mix, engagement, cadence, and follower quality.
4.98 /5 - from 58k reviews
Trusted by 50,000+ creators — get real engagement delivered to your profile in minutes, not days.
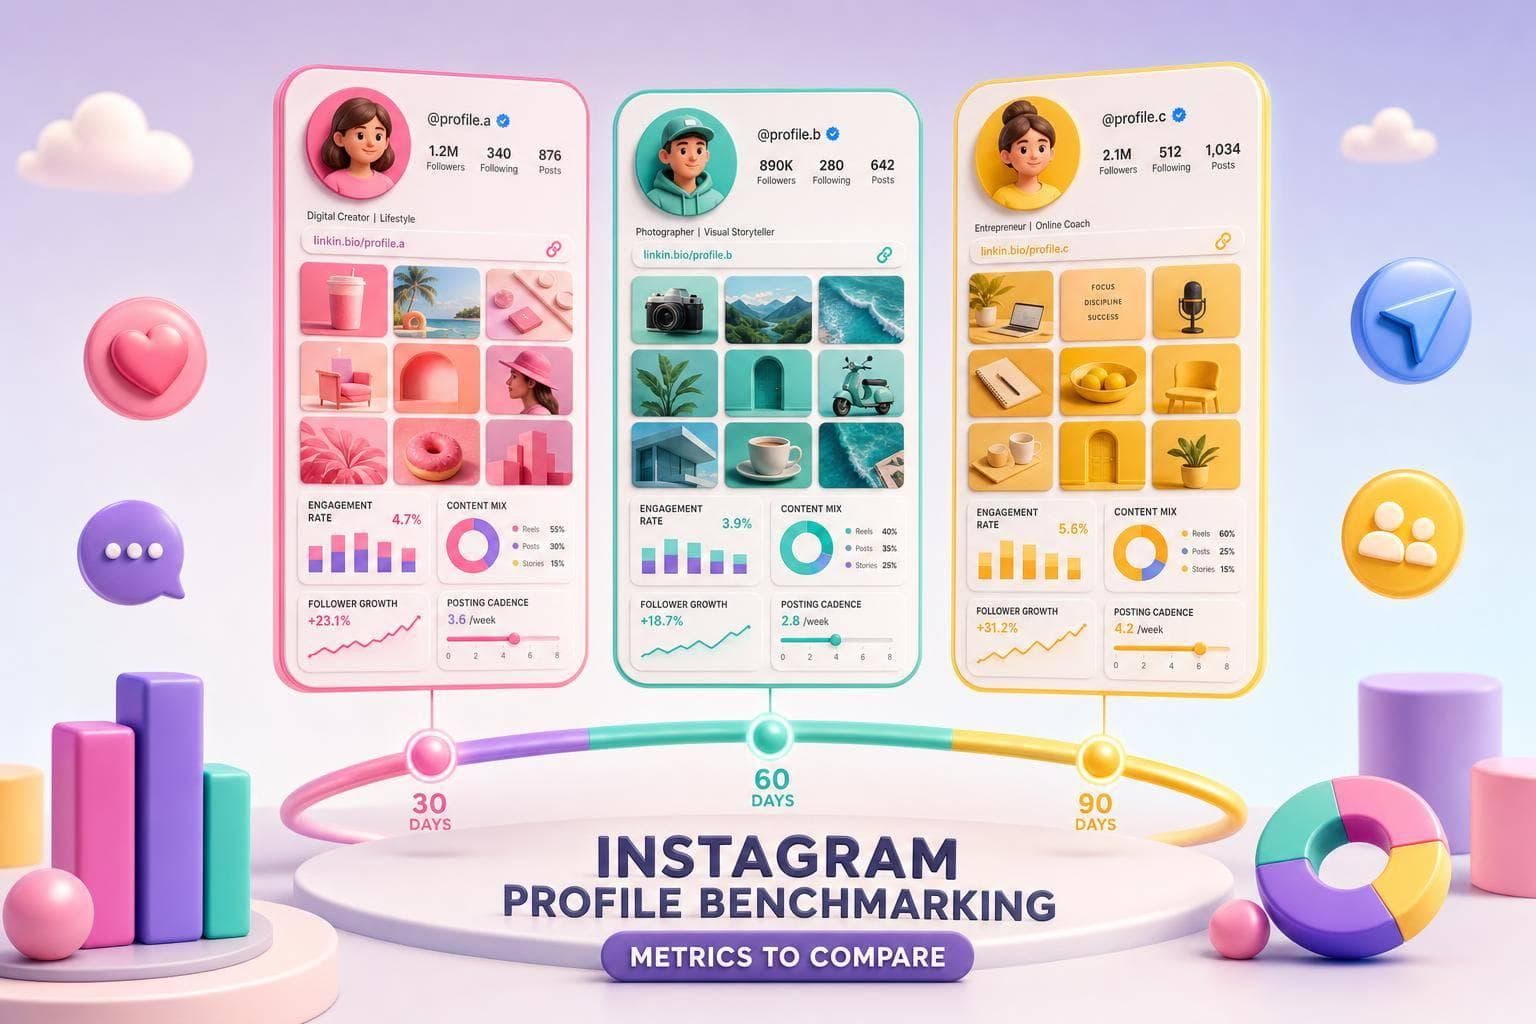
Most Instagram profile audits miss the point: a profile should be judged by how well it turns visits into follows, clicks, and replies. I’d review 5–10 similar accounts over the same 30- to 90-day window, then compare three things: what people see first, what makes them click, and how the audience responds.
Here’s the short version:
A few data points help frame the review:
What I’m looking for is simple:
Can a new visitor tell what the account does, trust it enough to stay, and know what to do next within a few seconds?
| Area | What I’d compare | What good looks like |
|---|---|---|
| Visuals | Profile photo, Highlight covers, pinned posts | Easy to recognize, easy to scan, clear intro/proof/offer |
| Bio | First line, keyword use, CTA, format | Short, direct, mobile-friendly, clear next step |
| Links | Bio link, link hub, contact buttons | Matches the CTA and sends people to the right page |
| Engagement | Likes, comments, saves, shares | Strong response for account type and size |
| Content mix | Reels, carousels, images | Mix fits the goal: reach vs. deeper response |
| Cadence | Posts per week, Stories per day, timing | Steady posting with no long gaps |
| Growth | Net new followers over 30 and 90 days | Steady growth that matches content activity |
If I were building this audit sheet, I’d keep it plain: same accounts, same dates, same metrics, every time.
Start by benchmarking the profile photo, Highlights, and pinned posts. These shape the first screen a visitor sees, so they do a lot of the heavy lifting.
The photo type should match the account type: a logo for brands, a headshot for creators, and a product image for ecommerce. If it's a headshot, it should feel trustworthy, with clear eye contact. If it's a product image, it needs to stay easy to recognize even at thumbnail size.
Keep the subject centered and the background simple. That helps the image read well in both Instagram's light and dark themes. Also check how it looks at 40–60 px, and upload it at 1,000 × 1,000 px to cut down on blur.
When you benchmark competitors, score each profile photo on three points:
After that, move to scanability. This is where Highlights and pinned posts come in.
Story Highlights should answer a new visitor's first questions fast. Score each account based on whether its Highlights explain:
Use short, benefit-led Highlight names like "Start Here", "Reviews", "FAQ," and "Offers." Keep the covers in line with brand colors and simple icons, since they show up as small circles.
Then look at the pinned posts. They should back up the same message. The top three pins should usually handle an intro, proof, and a current offer. When you're auditing competitors, ask a simple question: could a first-time visitor figure out the account's purpose and main offer from the pinned posts alone, without even opening the bio?
| Element | What to Check | Rating Scale |
|---|---|---|
| Profile Photo Type | Logo, headshot, or product image | - |
| Photo Color Contrast | Legibility in light and dark mode | Low / Medium / High |
| Highlight Cover Consistency | Unified colors, icons, and style | Inconsistent / Partial / Fully consistent |
| Highlight Naming | Short, descriptive, easy to scan | Vague / Mixed / Clear |
| Pinned Post Usage | Onboarding clarity, proof, and freshness | None / Basic / Optimized |
Next, compare the bio and link stack using proven Instagram marketing strategies, since that's where attention turns into clicks.
Next, benchmark the bio, keywords, and link stack. These pieces often decide whether profile interest turns into a click.
Score each bio for clarity, searchability, and CTA strength. When you benchmark bios, focus on five core elements: audience definition, offer or value proposition, positioning or credibility, formatting style, and call to action.
Strong bios make the value clear right away - ideally in the first line or even the first phrase. Then they back it up with proof and a clear CTA. A simple pattern to look for is audience → value proposition → proof or positioning → CTA.
Also compare dense paragraph bios with 2–4 line bios. Which one is easier to scan on mobile? In many audits, that answer is obvious within seconds. Note whether the first line clearly says who the profile is for or what it offers, or whether the point gets buried under generic brand language.
Track whether the name field includes a primary keyword, and whether the bio uses natural niche, location, or audience terms. Strong profiles often add a primary keyword to the name field next to the brand name - for example, UpGrow | Instagram Growth. Record whether each competitor uses category keywords, location terms, or audience descriptors instead of relying on brand language alone.
Emojis can help, but only in small doses. Track 2–4 emojis when they make the bio easier to scan. More than that usually just adds clutter.
Once the bio promise is clear, check whether the click path delivers on it. Track whether the account uses one direct link or a curated link hub. A direct link tends to work best when there is one clear goal. A link hub makes more sense when the profile needs to support several priorities at once.
The main question is simple: does the link setup match the current CTA? In other words, does it load well on mobile, and does it send visitors to a current offer instead of a generic homepage? That gap matters more than people think.
Also check whether business profiles have the right contact options turned on - such as email, call, or location buttons. These can add credibility and cut friction for people who are ready to reach out.
| Element | High-Performing Pattern | Weaker Pattern |
|---|---|---|
| Bio format | 2–4 short lines with selective emoji use | Dense, hard-to-scan paragraph |
| Bio structure | Audience, value, proof, CTA | No clear next step |
| Keyword in name field | Primary keyword plus brand name | Brand name only |
| Keyword in bio | Natural niche, service, location, or audience terms | Generic slogans with only brand language |
| CTA clarity | Specific action tied to the current offer | Vague prompt with no clear benefit |
| Link setup | Matched-to-CTA landing page or focused hub | Generic homepage or unfocused options |
| Contact options | Email, call, or location enabled when relevant | No visible contact actions on a business profile |
Instagram Engagement Benchmarks: Key Metrics for Profile Auditing
Once the profile is set up, the next step is simple: check whether it turns views into action. Follower count matters less than how people respond. This checklist looks at the signals behind that response.
After profile elements, measure whether the audience actually responds. Use the same formula across all accounts:
(likes + comments + saves + shares) ÷ followers × 100
If saves and shares are hidden, track likes and comments only. Just note that in your audit sheet so the comparison stays fair.
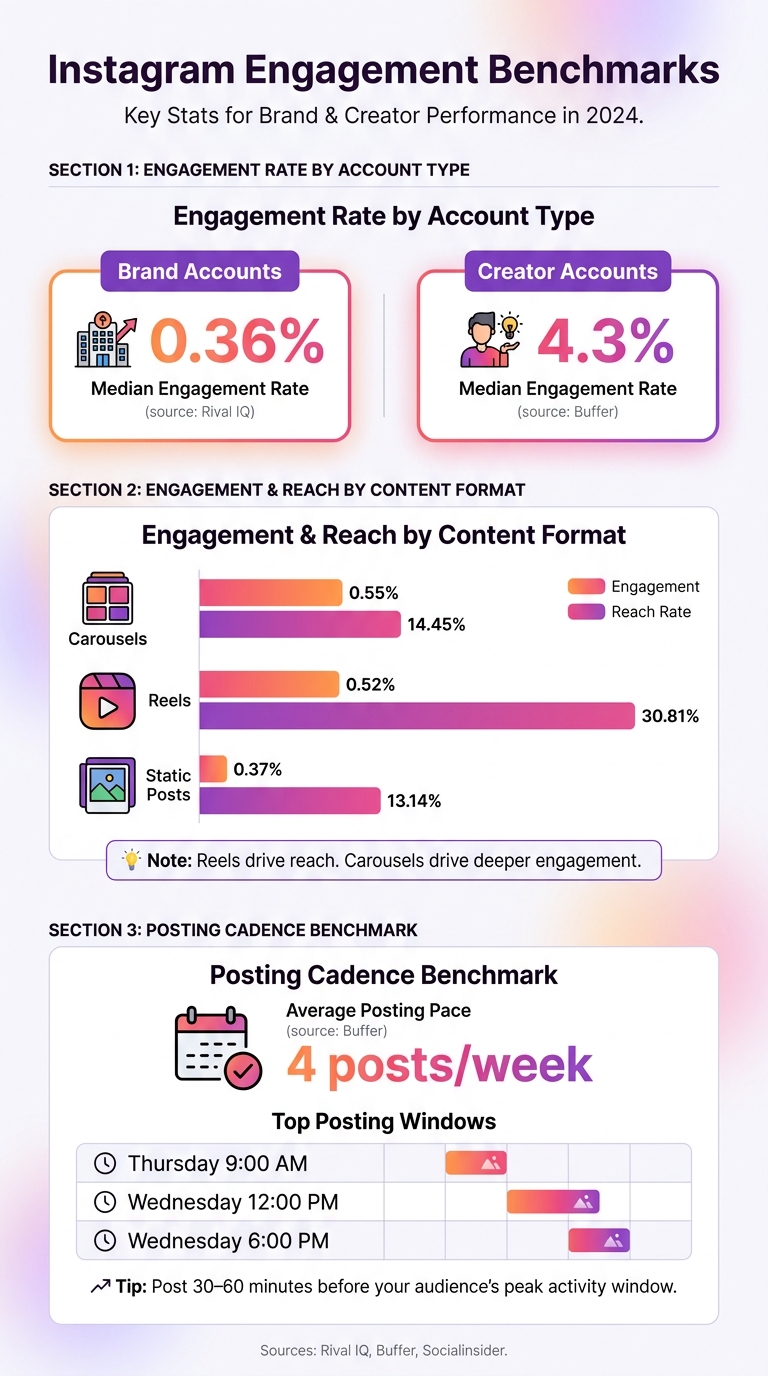
Use one engagement formula across every account, and compare brand accounts with brand accounts and creator accounts with creator accounts. Rival IQ reports a median engagement rate of 0.36% for brand accounts across industries. Creator accounts tend to be much higher. Buffer's analysis found a median of 4.3% among creators.
Content format shapes engagement too. Socialinsider's benchmark data shows carousels averaging 0.55% engagement, a bit ahead of Reels at 0.52%, while static posts trail at 0.37%. Reels, though, do better for reach, with a 30.81% reach rate versus 14.45% for carousels and 13.14% for static posts.
That split tells you a lot. Reels usually pull in reach. Carousels usually drive deeper engagement.
If engagement looks steady, check whether posting consistency supports it. For each account, count posts per week and average Stories per day over the past 30–90 days. Buffer's posting frequency benchmark puts the average at about 4 posts per week.
A steady cadence helps more than bursty posting. Long gaps without content are a clear risk signal.
For timing, log each post's timestamp and group posts into:
Use the audience's local time. Buffer's 2026 analysis of 9.6 million Instagram posts found Thursday at 9 a.m., Wednesday at 12 p.m., and Wednesday at 6 p.m. among the strongest posting windows. For your own account, Instagram Insights shows Most Active Times directly. Use that data and aim to post 30–60 minutes before the expected peak.
Track net follower growth over 30 and 90 days for each account. The formula is straightforward:
new followers minus unfollows
Then divide by the starting count to get a growth rate percentage.
Steady, gradual growth that lines up with content activity is a healthy sign. Sudden spikes with no matching campaign or viral post should be flagged.
When engagement is weak compared with follower size, or when growth jumps with no clear content trigger, that can point to inorganic growth. Look for steady follower growth paired with rising engagement, clicks, and profile actions. That helps separate real momentum from inflated follower counts.
Record the same fields for every account so month-over-month changes stay easy to compare.
| Account | Engagement Rate (% by Followers) | Avg Interactions/Post | Posts/Week | Content mix (% Reels / Carousels / Images) | 30-Day Net Follower Growth | Audience quality notes |
|---|---|---|---|---|---|---|
| Your Brand | - | - | - | - | - | - |
| Competitor A | - | - | - | - | - | - |
| Competitor B | - | - | - | - | - | - |
| Competitor C | - | - | - | - | - | - |
After you compare profile, bio, and Instagram metrics, pull everything into one audit sheet. Use the same audit window for every account, and write down the exact start and end dates on each sheet.
Once that window is set, your checklist should look at three layers: how the profile looks, how it communicates, and how it performs. Visual identity shapes the first impression. Bio and link setup influence whether visitors click or take action. And engagement plus audience signals show if the plan is paying off.
Track the same fields every time so each audit stays easy to compare.
| Category | Fields to Track |
|---|---|
| Visual Identity | Profile photo style, brand color consistency, overall aesthetic |
| Bio & Keywords | Bio format, value proposition clarity, niche keywords, CTA presence |
| Links & Actions | Link type (single URL vs. multi-link tool), number of destinations, contact buttons, profile actions |
| Highlights & Pins | Number of Highlights, cover icon consistency, category names, pinned post type |
| Engagement | Rate by format, content mix, and likes, comments, saves, shares |
| Cadence | Posts per week, timing patterns, content consistency |
| Audience Signals | 30-day net follower growth, demographic fit, click-through rates, authenticity notes |
Add a short notes and next steps column beside each row. That way, the sheet does more than store observations. It gives you a clear action list.
If you want one place to track these fields, UpGrow can centralize the audit data. Its real-time analytics dashboard, AI targeting, and profile optimization tools help track follower growth quality and audience fit across audit cycles.
Run the same checklist, review the same accounts, and make one or two changes before the next audit.
Focus on the metrics that show interest and conversion, not just surface-level views.
These numbers tell a much clearer story. A post with lots of reach might look good at first glance, but if no one saves it, shares it, or clicks through to your profile, it’s probably not doing much for your business.
If you want to make audits less of a manual chore, UpGrow can help with real-time tracking for profile activity, follower growth, and engagement trends.
Benchmark your Instagram profile against your goals on a simple schedule:
UpGrow can support these audits with real-time analytics and a live dashboard, so you can keep an eye on performance and audience signals as they come in.
As of 2026, the average Instagram engagement rate across account types sits at 1.2%. But that number only tells part of the story.
Your engagement rate can shift a lot based on account size and content format.
For example, micro-influencers with 10,000 to 100,000 followers often land in the 2% to 4% range. Larger accounts tend to see lower rates. Macro-influencers with more than 1 million followers usually fall between 0.5% and 1%.
Content type matters too. Reels and other video posts often hit 2% to 4%, which is much higher than many static posts. By comparison, static images usually sit around 0.8% to 1.5%.
As a rule of thumb, hitting 3.5% or more is often seen as excellent on Instagram.