
How to Track Instagram Engagement Live
Monitor likes, comments, saves, shares and reach at set checkpoints; calculate live engagement for posts, Stories, and Reels.
Monitor likes, comments, saves, shares and reach at set checkpoints; calculate live engagement for posts, Stories, and Reels.
4.98 /5 - from 58k reviews
Trusted by 50,000+ creators — get real engagement delivered to your profile in minutes, not days.
If I want to know whether an Instagram post is working, I don’t wait a day. I check it at set times like 15 minutes, 1 hour, 6 hours, and 24 hours. That gives me early numbers on likes, comments, saves, shares, reach, taps, replies, and profile visits while Instagram is still showing the content to people.
Here’s the short version:
A few numbers matter more than others early on. In the first hour, I watch likes, plays, and comments. After that, I check shares, saves, reach, replies, link taps, and profile visits. For Reels, I also compare plays vs. reach. If plays are high but saves and shares stay low, the Reel may be getting views without much action.
| Format | Early metrics to check | Later metrics to check | Main note |
|---|---|---|---|
| Post | Likes, comments | Saves, shares, reach, profile visits | Saves and shares often say more than likes |
| Story | Reach, replies | Taps, exits, sticker/link taps | Exits can show where people drop off |
| Reel | Plays, likes, comments | Saves, shares, reach | Plays can be higher than reach because of replays |
I’d keep the process simple: set up the account, build one tracking sheet, check Insights on schedule, and use the same formula every time. That makes each post easier to compare without guessing.
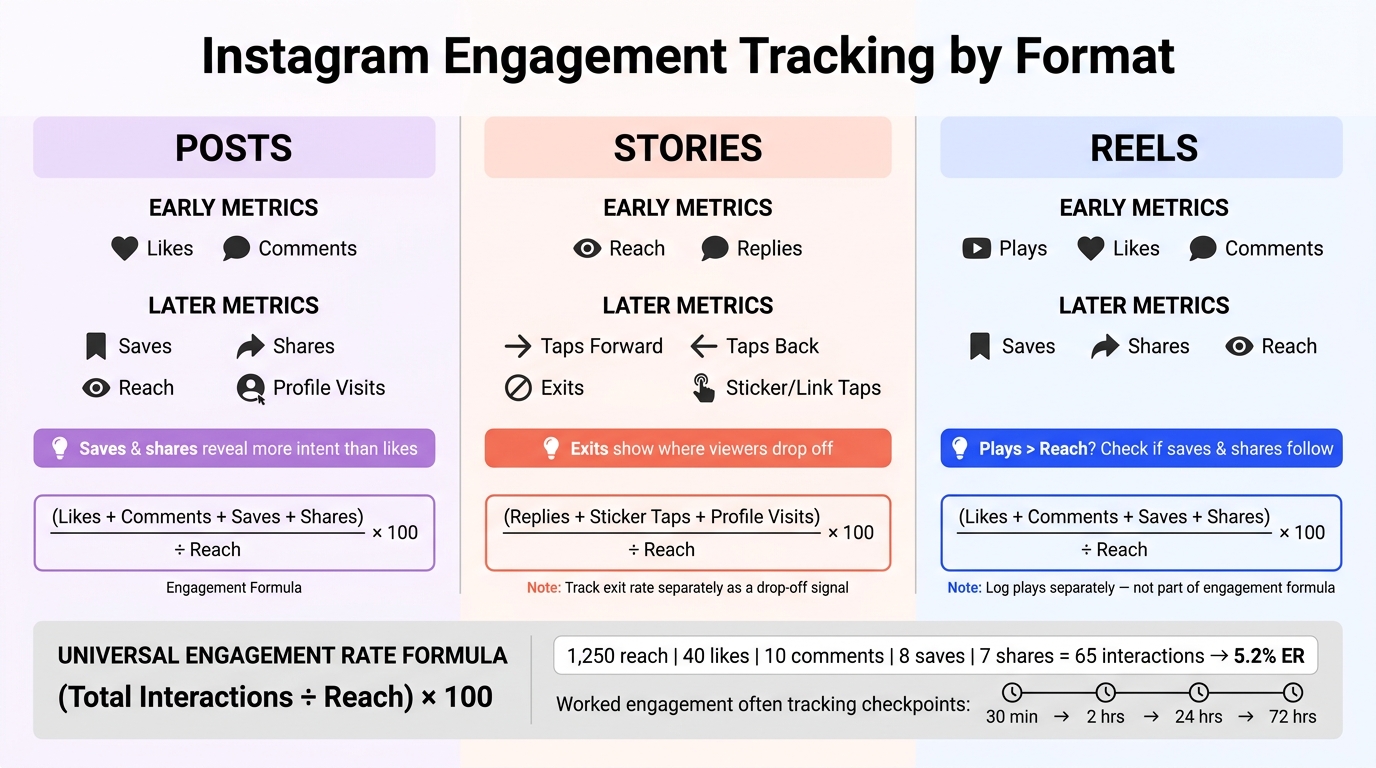
Instagram Engagement Tracking: Posts vs. Stories vs. Reels
Before you track live performance, make sure your account is set up as a Professional account. Instagram only shows Insights for Professional accounts, so this comes first.
Open the Instagram app and tap your profile icon in the bottom-right corner. Then tap the three-line menu (≡) in the top-right. Go to Settings and privacy, scroll down to For professionals, and tap Account type and tools.
From there:
Choose Creator or Business based on how you run the account. Both give you access to Instagram Insights.
To open Insights, use the three-line menu or tap View insights under your posts and Reels. For Stories, swipe up or tap the Insights icon to see post-level metrics. Once Insights shows up, you're set.
With Insights active, the next move is simple: build your tracking log before the next post goes live.
Use one template for every post, Story, and Reel. That keeps your numbers clean and easy to compare.
Set up your tracking sheet before publishing so each post follows the same log. Add the content type, publish date in MM/DD/YYYY format, publish time in 12-hour format with AM/PM, and the campaign name or objective. Stick to the same time zone for every entry.
Then add checkpoints as separate columns or rows. A simple setup might look like this:
This way, you can record live engagement at the same intervals across posts, Stories, and Reels.
Once your tracking sheet is set, open the matching Insights screen at each checkpoint and log the numbers. The job is simple: check the right metric, write it down, and move on before the next checkpoint. Start with feed posts, then check Stories and Reels.
Open the post from your profile and tap View insights. This brings up the Insights screen with likes, comments, saves, shares, reach, and profile visits.
Reach shows how many unique accounts saw the post. Total interactions, like comments, saves, shares, and likes, show how many people did something after seeing it. Saves and shares often tell you more than likes alone. A save usually means someone wanted to come back to the post. A share suggests they thought it was worth sending to someone else.
While a Story is still active, open it and swipe up or tap the Insights icon to see live metrics. You’ll find reach, taps forward, taps back, exits, replies, and sticker or link interactions.
Each swipe metric points to a different kind of viewer behavior. Taps forward can mean people skipped ahead. Taps back often mean they rewatched or reread something. Exits show where attention fell off. If one frame has a jump in exits, that’s a clear clue about what to change in the next Story. Replies and sticker taps are high-intent signals because the viewer took an action instead of just watching.
Reels follow a similar path, but the numbers you watch most are plays and reach.
Open the Reel, tap the three-dot menu, then select Insights. You’ll see plays, reach, likes, comments, shares, and saves.
Here, the main focus is on plays and reach. Plays include replays, so that number can be higher than reach. If reach and plays look high but saves and shares stay low, the Reel may be getting broad exposure without pushing viewers to take a stronger next step.
Once the live metrics are in Insights, turn them into one number you can compare across posts.
Pull likes, comments, saves, shares, and reach from Insights. Then use this standard live formula: Engagement Rate = (Total Interactions ÷ Reach) × 100.
What goes into total interactions depends on the format:
Here’s a simple example. Say a post at 2:00 PM has 1,250 reach, 40 likes, 10 comments, 8 saves, and 7 shares. That gives you 65 total interactions. The engagement rate is 5.2%.
Use reach every time. Don’t switch to impressions.
Use the same formula each time and log every checkpoint in one spreadsheet. Keep one row per piece of content and include these fields:
Log updates at the same checkpoints every time. Add separate columns for each interval, such as ER T+3h and ER T+24h, so you can track how the rate changes as the post gets older. Put the formula in the spreadsheet header too, so nobody changes it halfway through a campaign.
If you want faster, live reporting, move those same fields into a dashboard.
When manual logs start slowing you down, it makes sense to move those same metrics into a live dashboard. Spreadsheets work fine at first. But as publishing volume goes up, keeping everything updated by hand can turn into a chore.
A good dashboard should do what your spreadsheet does, just without the manual work. It should pull in new data on its own so you can check performance without bouncing between tabs or typing in numbers.
Look for features like:
UpGrow's live dashboard gives you real-time engagement metrics and scheduled reporting in one place. That makes it handy when you're tracking reach, saves, shares, and Story interactions across many posts without switching screens.
Use the simplest workflow that still gives you live data after every post, Story, and Reel.
Early on, prioritize saves and shares over likes. They show deeper audience interest and often matter more for early distribution and reach.
Track those metrics soon after posting, especially in the first 30–90 minutes. That gives you a fast read on engagement velocity and helps you decide if you should tweak the content or boost amplification right away.
Check Instagram Insights in two phases.
For new posts, watch the first 30–90 minutes after publishing, with extra attention on the first hour. That’s when you can spot early engagement movement and see whether a post is starting to pick up steam.
After that, shift to a steadier review rhythm:
In many cases, metrics settle after 48–72 hours, so early numbers can change a bit before the picture becomes clearer.
Stories move fastest. They’re the most time-sensitive format, and their data is usually available for about 24 hours after posting.
Prioritize reach because it tracks the unique accounts that saw your content. That makes it a cleaner way to judge how well you're connecting with your audience.
Impressions can be misleading because they include repeat views from the same person. Reach, on the other hand, shows whether your content is getting in front of people beyond your current followers.
It also gives you a more accurate engagement rate because it avoids inflated view counts.


