
Instagram Statistics 2026: 150+ Facts, Users & Trends (Master Hub)
Instagram dominates 2026 with 3B users, 73 min/day, Reels-driven discovery, and $37.7B in commerce.
Instagram dominates 2026 with 3B users, 73 min/day, Reels-driven discovery, and $37.7B in commerce.
4.98 /5 - from 58k reviews
Trusted by 50,000+ creators — get real engagement delivered to your profile in minutes, not days.

Instagram is still one of the biggest social apps in 2026: it has 3 billion monthly users, more than 500 million daily users, 1.99 billion in ad reach, and people spend about 73 minutes a day on it.
If I had to sum up the whole article in a few lines, it’s this: Instagram wins on scale, shopping, and ad reach. Reels drive discovery. Stories help keep followers warm. Smaller accounts often get better engagement rates than large ones. And if you compare it with TikTok, TikTok gets more time and engagement, while Instagram does more for sales and product discovery.
Here’s the fast version:
If you want the plain-English takeaway, here it is: Instagram is no longer just a photo app. It’s now a video, messaging, ads, creator, and shopping platform at huge scale. That’s the lens I’d use for every stat in this hub.
| Metric | TikTok | |
|---|---|---|
| Monthly users | 3 billion | 1.8B–1.99B |
| Daily time spent | 73 minutes | 95–97 minutes |
| Ad reach | 1.99 billion | ~1.2 billion |
| Engagement | Lower overall | Higher overall |
| Conversion rate | 2.8% | 1.3% |
| Avg. order value | $68 | $51 |
| Commerce revenue | $37.7 billion | $28.4 billion |
So before you dig into the Instagram stats, the short answer is simple: Instagram is one of the best platforms in 2026 if your goal is reach, product discovery, and sales.
Instagram has 3 billion monthly active users in 2026. On a daily basis, it has 500 million+ daily active users. Its ad reach stands at 1.99 billion as of April 2026, which counts only targetable accounts.
That gap matters. Monthly users show the app’s total scale, while ad reach shows how many accounts marketers can actually target.
Another sign of heavy use: 65.4% of users open the app daily.
"Almost all of our growth has been driven by DMs, Reels, and recommendations." - Adam Mosseri, Head of Instagram
People spend a global average of 73 minutes per day on Instagram, based on DataReportal’s 2026 data. They also open the app 7.1 to 7.8 times daily.
That tells a pretty clear story: Instagram isn’t just a place people check once and leave. It pulls users back again and again during the day.
Age and geography shape these usage patterns, which the demographics section breaks down next.
Geography helps explain where Instagram is biggest and where it’s still adding users at a strong pace.
India leads by a wide margin with 480.55 million users. That is more than double the U.S. total of 181.75 million. Brazil ranks third at 147 million, followed by Indonesia at 104 million and Turkey at 57 million. About 87% of Instagram users live outside the United States.
| Country | Users | Source | Year |
|---|---|---|---|
| India | 480.55M | Statista / DataReportal | 2025 |
| United States | 181.75M | Statista / DataReportal | 2025 |
| Brazil | 147.00M | Statista / DataReportal | 2025 |
| Indonesia | 104.00M | Digital Applied | 2026 |
| Turkey | 57.00M | Digital Applied | 2026 |
| Japan | 54.00M | Digital Applied | 2026 |
Note: Country figures are the latest available 2025–2026 estimates and do not all come from the same release cycle.
The pattern is hard to miss. A large share of Instagram’s scale sits in a handful of big markets, and much of the newer growth is coming from South and Southeast Asia. That also helps explain why growth is easing in older markets while moving faster elsewhere.
For 2026, growth is projected at 5.4%–6.3%, following a 15.3% jump in 2025. Western markets are nearing saturation, and most new users are coming from South and Southeast Asia, with India playing a major role.
| Year | Global MAU | Ad Reach | YoY Growth |
|---|---|---|---|
| 2022 | 2.0B | ~1.4B | - |
| 2023 | 2.35B | ~1.6B | 17.5% |
| 2024 | 2.6B | 1.69B | 10.6% |
| 2025 | 3.0B | 1.91B | 15.3% |
| 2026 (projected year-end) | 3.15B | 1.99B | 5.4%–6.3% |
Sources: DataReportal, Meta, Statista
Instagram’s average engagement rate across the platform sits at just under 0.5% in 2026. At the same time, reach-based studies put that number as high as 3.54%.
The big reason for that gap is simple: format matters a lot.
Reels pull 67% higher engagement than static posts, reach 2.1x more non-followers, and carousels get 9x more saves than single-image posts. So if you want more reach or more interaction, format is usually the first thing to fix.
| Format | Avg. Engagement Rate | Reach (% of followers) | Source | Year |
|---|---|---|---|---|
| Reels | 1.48% | 33.8% | Hootsuite / Searchlab | 2026 |
| Carousels | 1.26% | 14.6% | DigitalApplied | 2026 |
| Single Image | 0.89% | 12.1% | DigitalApplied | 2026 |
| Stories | 0.44% tap-forward rate | 5.4% | Rival IQ / Searchlab | 2026 |
Account size plays a big part too. Nano accounts with 1,000–10,000 followers average a 2.53% engagement rate, while mega accounts with 1M+ followers fall to 0.37%.
For the full breakdown by account size and industry, see our deep dive on Instagram engagement rate statistics and average likes per post on Instagram.
Reels now do most of the heavy lifting for discovery.
They account for 46% of all time spent on Instagram, and users watch 200 billion Reels every day across Facebook and Instagram combined. On top of that, Reels are reshared more than 4.5 billion times per day.
Length has a huge effect on how long people stick around. Reels under 30 seconds hold a 72% completion rate, while Reels over 60 seconds drop to 28%. That’s a steep falloff.
Timing matters too. The first 72 hours after posting are the key window. Reels get about 65% of their total views and 61% of their interactions during that period.
Stories play a different role. Reels help people find you. Stories help you stay in front of people who already follow you. Their reach is much lower, at 5.4% of followers, so they work more like a retention tool than a discovery engine.
For the full picture on both formats, explore Instagram Reels statistics and Instagram Stories statistics.
Instagram’s largest age group worldwide is 25–34, which makes up 31.7% of all users. If you zoom out a bit, users aged 18–34 account for over 60% of the total audience.
Among usage patterns, women aged 16–24 stand out as the most active group, with 69.4% using Instagram daily.
The gender split worldwide is close to even: 51.8% male and 48.2% female. In the United States, Instagram use is especially high among younger adults, with 80% of adults ages 18–29 using the platform.
Geography changes the mix, which is why country-level data matters when you’re trying to understand the audience in front of you. For the full country-by-country and age breakdown, see Instagram demographics.
"Users spend close to two-thirds of their Instagram time watching videos." - Jasmine Enberg, Analyst, eMarketer
Instagram organic reach leans HARD toward smaller accounts. The smaller the audience, the bigger the share of followers that tend to see a post.
| Follower Tier | Avg. Reach (% of Followers) | Avg. Engagement Rate | Year |
|---|---|---|---|
| Under 1K | 33.8% | 3.81% | 2026 |
| 1K–10K | 14.6% | 2.53% | 2026 |
| 10K–50K | 12.1% | 1.41% | 2026 |
| 100K–500K | 5.4% | 0.92% | 2026 |
| 1M+ | N/A | 0.68% | 2026 |
Source:
The pattern is pretty clear: once an account gets bigger, reach and engagement usually drop. Nano accounts average 91 likes per post, while micro accounts average about 400 to 1,200 likes per post. At the same time, Reels organic reach is up 12% year-over-year, while static feed post reach is down 8%.
That gap matters because it shapes what brands pay for. In many cases, audience size still sets the rate card.
For a closer look at format and account-size trends, see Instagram organic reach statistics and average likes per post on Instagram.
Instagram’s creator economy is worth $21 billion in 2026, and brands spend $8 billion per year on Instagram influencer marketing. But the money isn’t spread evenly. Only about 4.2% of active creators earn more than $50,000 annually.
Sponsored post pricing climbs fast as follower counts grow. A nano-creator may earn $50 to $300 per post, while a celebrity account can charge $500,000 or more.
| Creator Tier | Follower Count | Typical Rate per Sponsored Post |
|---|---|---|
| Nano | 1K – 10K | $50 – $300 |
| Micro | 10K – 50K | $500 – $2,500 |
| Mid-tier | 50K – 500K | $2,500 – $10,000 |
| Macro | 500K – 1M | $10,000 – $25,000 |
| Mega | 1M+ | $10,000 – $50,000+ |
| Celebrity | 10M+ | $50,000 – $500,000+ |
Source:
Brands are also shifting down-market. Micro-influencer campaigns are growing 40% faster than macro-influencer campaigns in 2026, helped by a 2.8x higher ROI than mega-influencers. And when brands do influencer deals, 67% now prefer Reels over static posts.
Another thing worth watching: Creator Subscriptions are up 74% year-over-year, with an average price of $7.99/month.
For more detail, check creator economy statistics, how much Instagram influencers make, and how much money you can make on Instagram.
Instagram now reaches far past posting and scrolling. It’s a business tool, an ad platform, a shopping channel, and more and more, a place where deals happen inside DMs.
There are now over 200 million business profiles on the platform, and 90% of users follow at least one business account.
Shopping behavior on Instagram is strong:
That adds up to scale. Social commerce through Instagram reached $37.7 billion in 2026.
On the ad side, Instagram now brings in 50.3% of Meta’s total U.S. ad revenue, passing Facebook for the first time. Projected ad revenue for 2026 falls between $42.52 billion and $65.2 billion. Reels ads are now the lower-cost option, with a CPM of $6.20 to $7.20 versus $8.80 to $9.00 for feed ads, and they drive 22% higher engagement than feed placements.
DM-led commerce is growing fast too. 150 million users send a DM to a business every month, and DM-driven commerce is up 89% year-over-year. Businesses with native Instagram Shops generate 44% more revenue from the platform than those without.
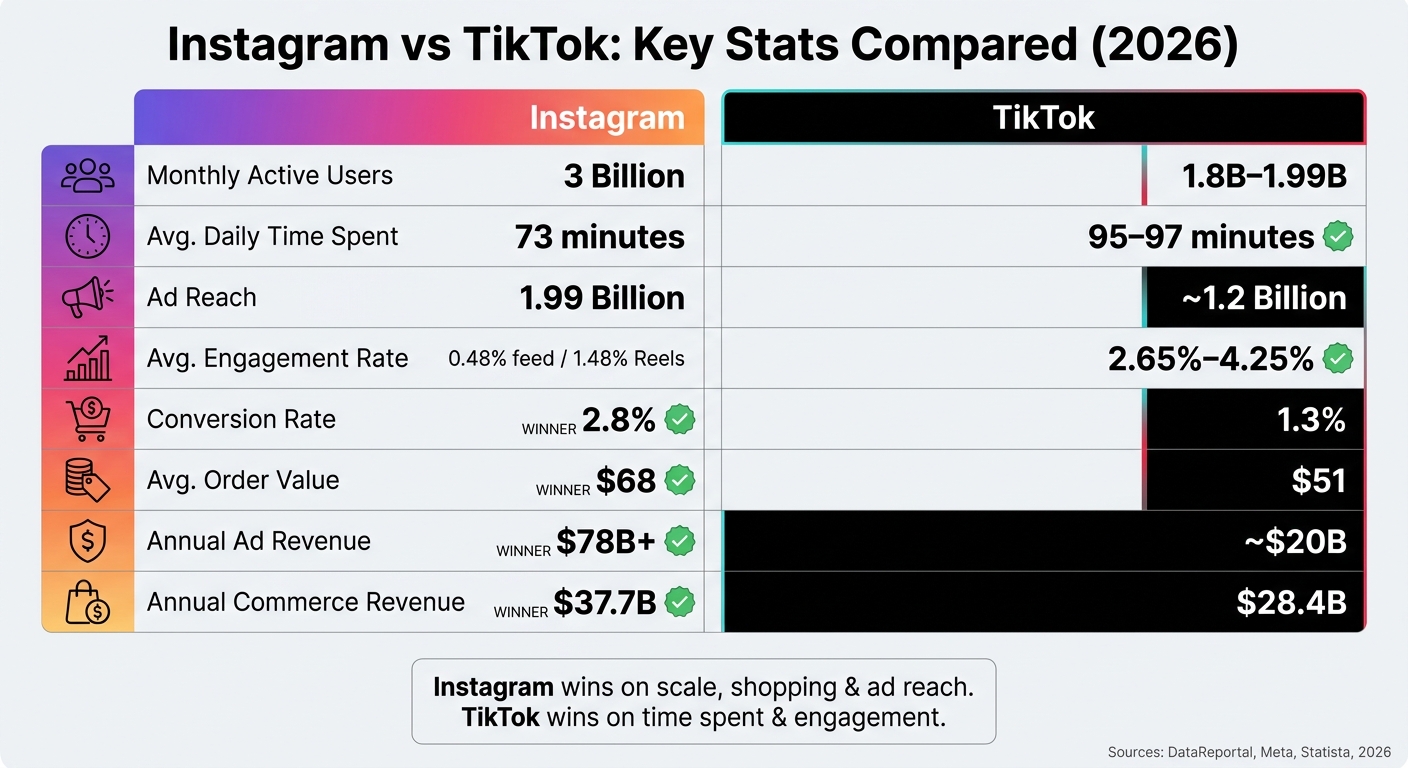
Instagram vs TikTok: Key Stats Compared (2026)
Instagram wins on scale and shopping. TikTok wins on time spent and engagement.
Once you look past raw reach, the split gets clearer. In 2026, Instagram is the stronger pick for brands that want sales. TikTok is still a major force for attention and content testing.
| Metric | TikTok | Year | |
|---|---|---|---|
| Monthly Active Users | 3 billion | 1.8B–1.99B | 2026 |
| Avg. Daily Time Spent | 73 minutes | 95–97 minutes | 2026 |
| Ad Reach | 1.99 billion | ~1.2 billion | 2026 |
| Avg. Engagement Rate | 0.48% (feed) / 1.48% (Reels) | 2.65%–4.25% | 2026 |
| Conversion Rate (product links) | 2.8% | 1.3% | 2026 |
| Avg. Order Value | $68 | $51 | 2026 |
| Annual Ad Revenue | $78B+ | ~$20B | 2026 |
| Annual Commerce Revenue | $37.7B | $28.4B | 2026 |
Those gaps matter most if your goal is revenue, not just views. For direct-response campaigns, Instagram’s higher conversion rate and larger average order value can matter more than TikTok’s stronger engagement. A simple way to think about it: use TikTok to test what gets attention, then use Instagram to put more spend behind what already sells.
For the full side-by-side breakdown, see Instagram vs TikTok statistics.
Instagram’s story in 2026 comes down to one thing: scale is big, but conversion is bigger. The platform reached 3 billion monthly active users, its ad system reaches 1.99 billion people worldwide, and it now brings in 50.3% of Meta's total U.S. ad revenue. At the same time, Reels drive most discovery, and social commerce has grown to $37.7 billion.
Put that together, and the picture is pretty clear. Instagram is the top platform for commercial intent at scale. Growth still depends on getting in front of the right people, which is where UpGrow can help with real, targeted follower growth.
Last updated: July 2026


&description=Instagram%20dominates%202026%20with%203B%20users%2C%2073%20min%2Fday%2C%20Reels-driven%20discovery%2C%20and%20%2437.7B%20in%20commerce.&image=https://www.upgrow.com/blog-images/assets.seobotai.com/cdn-cgi/image/quality=75,w=1536,h=1024/upgrow.com/6a4df7bd7b335034c3b65c3f-1783496470323.jpg)