Instagram Reels Statistics 2026: Views, Watch Time, Reach & Engagement (35+ Stats)
2026 benchmarks for Instagram Reels: reach, watch time, engagement, top lengths (15–30s), and best posting windows.
2026 benchmarks for Instagram Reels: reach, watch time, engagement, top lengths (15–30s), and best posting windows.
4.98 /5 - from 58k reviews
Trusted by 50,000+ creators — get real engagement delivered to your profile in minutes, not days.
Instagram Reels are still the top format for discovery in 2026. If I had to sum up the data in one line, it’s this: Reels get seen by more new people, hold more attention when they’re short, and beat most other Instagram formats on reach and interaction.
Here’s the short version:
If you want the plain-English takeaway, it’s simple: Reels are less about posting more and more about getting people to keep watching. Reach helps, but repeat viewing, watch time, shares, saves, and non-follower response are what move a Reel further.
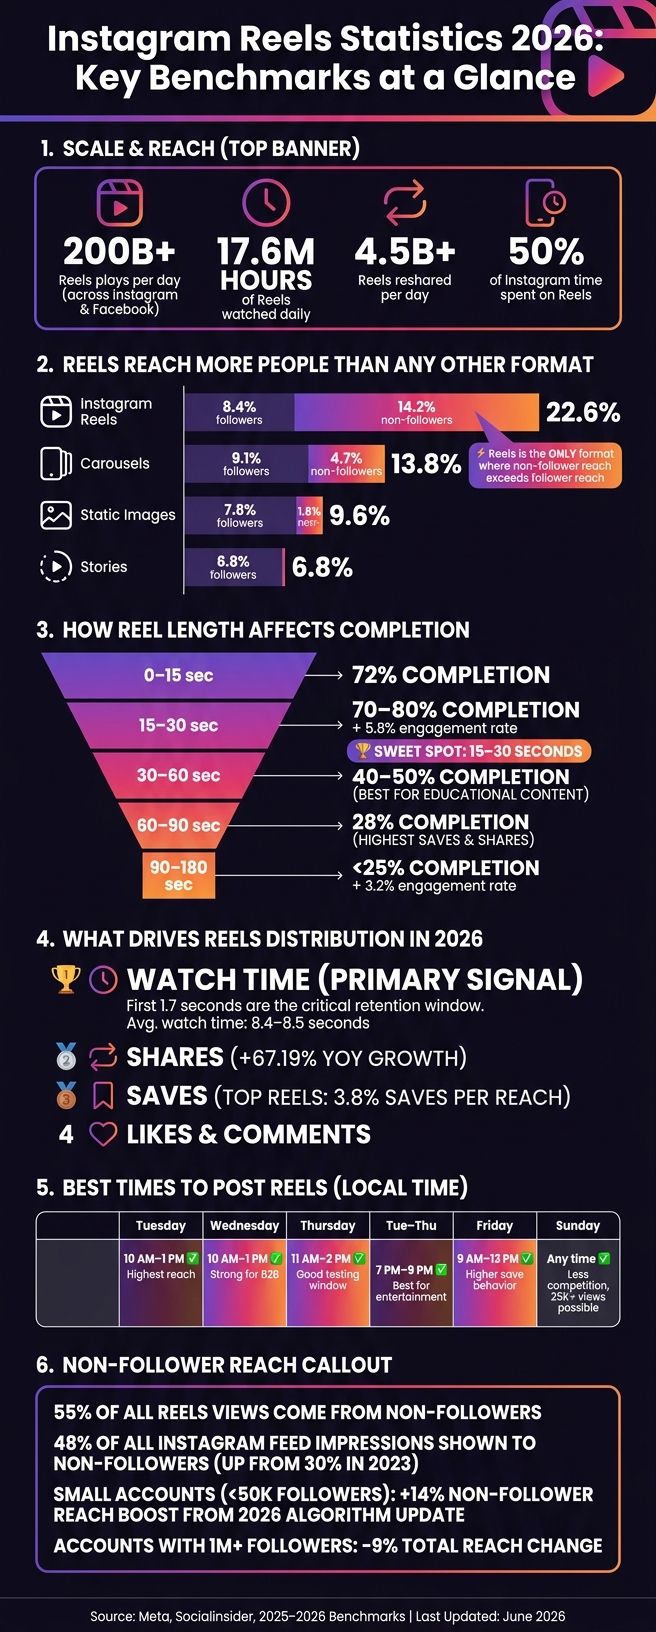
Instagram Reels Statistics 2026: Key Benchmarks at a Glance
| Metric | What the data shows |
|---|---|
| Daily scale | 200B+ plays per day |
| Time spent | 50% of Instagram time goes to Reels |
| Non-follower views | 55% |
| Avg. watch time | 8.4–8.5 seconds |
| Key retention point | First 1.7 seconds |
| Best short length | 15–30 seconds |
| Completion rate | 72% for very short Reels; 46% or lower after 60 seconds |
| Best use case | Discovery and audience growth |
| Best posting days | Tuesday, Wednesday, Thursday |
| Best posting times | 10:00 AM–1:00 PM, plus 7:00 PM–9:00 PM for entertainment (including Saturdays) |
So if you’re looking at Reels in 2026, I’d focus on three things: non-follower reach, watch time, and completion. Those numbers tell you a lot more than views alone.
Meta reported that Reels are played more than 200 billion times per day across Instagram and Facebook combined as of 2026. Users spend 17.6 million hours a day watching Reels.
That kind of volume matters for one simple reason: a lot of Reels views don’t come from people who already follow the creator. In many cases, distribution starts well beyond your own audience.
Since April 2025, Instagram has labeled Reels performance as "Views" instead of "Plays" or "Impressions". Reels are also reshared more than 4.5 billion times per day, which makes shares one of the main signals behind how far a Reel can spread.
55% of all Instagram Reels views come from non-followers. That’s a big deal if you’re trying to grow, because it means more than half of Reels viewing comes from people who haven’t chosen to follow yet.
The same pattern shows up across Instagram more broadly. In 2026, about 48% of all Instagram feed impressions are shown to users who don’t follow the creator, up from 30% in 2023.
Meta’s 2026 algorithm rebalancing pushed that trend even further. It increased non-follower reach by 14% for accounts with fewer than 50,000 followers. For smaller accounts, that shifts the game a bit. You’re not limited to your current audience nearly as much as before. Using an Instagram growth service can help capitalize on this non-follower reach.
Non-follower reach only matters if it turns into repeat viewing. A burst of views might look good at first, but it doesn’t build much on its own.
What matters is whether those new viewers come back, watch more, and start moving toward follow-worthy behavior. That’s why it helps to track which Reels pull in the right people with an engagement rate calculator - and which ones turn casual discovery into steady audience growth.
Instagram Reels reach more people than any other Instagram format when you look at organic distribution. That shows up most clearly in non-follower discovery. Reels still lead every other format on reach benchmarks or use an Instagram engagement calculator to see how your own metrics stack up.
Benchmark studies put Reels reach rates between 30.81% and 33.8%. Another benchmark set, which splits reach into follower and non-follower share, puts Reels at 22.6%. Since these studies use different methods and account groups, the table below uses the second dataset so the format-to-format comparison stays consistent.
| Format | Avg. Reach Rate | Follower Reach | Non-Follower Reach | Reach vs. Static Images |
|---|---|---|---|---|
| Instagram Reels (under 60s) | 22.6% | 8.4% | 14.2% | 2.35x |
| Carousels | 13.8% | 9.1% | 4.7% | 1.44x |
| Static Images | 9.6% | 7.8% | 1.8% | 1.00x (Base) |
| Stories | 6.8% | 6.8% | ~0% | 0.71x |
That gap matters. Reels are the ONLY format here where non-follower reach is bigger than follower reach.
Single-image post reach dropped 21.96% year over year in 2026. At this point, static images are seen mostly by people who already follow the account, which makes them much weaker for growth than Reels.
The gap gets bigger for small accounts and tighter for large ones. Instagram's 2026 algorithm update increased non-follower reach by 14% for accounts with under 50,000 followers. At the other end, accounts with more than 1 million followers saw a 9% drop in total reach.
| Follower Count | Avg. Follower Reach % | Avg. Non-Follower Reach % | Total Avg. Reach % | YoY Change |
|---|---|---|---|---|
| Under 10K | 16.4% | 21.8% | 38.2% | +6% |
| 10K–50K | 11.2% | 18.6% | 29.8% | +4% |
| 50K–200K | 8.4% | 16.1% | 24.5% | +1% |
| 200K–1M | 6.7% | 12.4% | 19.1% | -3% |
| 1M+ | 4.2% | 8.9% | 13.1% | -9% |
Put simply, smaller accounts got more of a lift, while very large accounts got less.
Reach by itself doesn't tell the whole story. The bigger point is how each format gets distributed.
Reels spread through the Reels tab, Explore, and suggested feed placements. Brands can also analyze competitor ads to see how they leverage these placements for reach. Stories stay mostly inside an account's current audience, with non-follower reach close to zero. That's a huge difference if the goal is discovery instead of just staying visible to current followers.
Reels also make up 53% of all content surfaced on the Explore page and produce 3.5x more reach than carousel content. Carousels still do well with existing audiences. In fact, they have the highest follower reach at 9.1%, which makes them a better fit for people who already know the account. Reels are built for broader discovery, while Stories and carousels lean more on follower-based distribution.
Average Instagram Reels engagement ranges from 1.48% to 5.53%, depending on whether studies measure engagement against reach or followers. That gap matters. If you compare by reach, the number can look one way. If you compare by followers, it can look very different—a distinction often highlighted when you compare Instagram influencers side by side.
Follower count also changes the picture fast. Smaller accounts tend to get more interaction, while large accounts often see lower rates. Nano-accounts reach 2.53% to 8%, while mega-accounts can fall to 0.37%.
Reels also beat standard feed content on engagement. One benchmark puts Reels at 1.48%, compared with 0.99% for carousels and 0.70% for static images. That matters for ranking too. You can even test your knowledge of Instagram metrics to see how these benchmarks impact your specific account. More engagement can signal stronger content quality to the algorithm, which can help push a Reel past its first audience.
Still, engagement only tells part of the story. Watch time has more weight for distribution.
Average watch time for Reels in 2026 is 8.4 to 8.5 seconds. In practical terms, that means people decide fast whether a Reel is worth sticking with.
Watch time is the main ranking signal for Reels distribution in 2026. After that come shares, saves, and likes. So if a Reel gets attention but people drop off early, it may struggle to spread.
The first 1.7 seconds are the key retention window. That opening has to do a lot of work. It needs to stop the scroll, set up the point, and make people want the next second.
Shares on Reels increased 67.19% year over year, which shows how much shareability now matters. For top-performing Reels, two useful benchmarks stand out:
Another metric worth watching is replay rate. A replay rate above 1.1 - total plays divided by accounts reached - can signal strong distribution potential.
Length shapes completion, and completion shapes reach.
| Reel Length | Avg. Completion Rate | Avg. Engagement Rate / Performance |
|---|---|---|
| 0–15 seconds | 72% | 72% completion rate |
| 15–30 seconds | 70%–80% | 5.8% engagement rate |
| 30–60 seconds | 40%–50% | Strong performance for educational content |
| 60–90 seconds | 28% | Highest total saves and shares |
| 90–180 seconds | <25% | 3.2% engagement rate |
Shorter Reels tend to hold attention better, which helps explain why 0–15 second clips hit a 72% completion rate. The 15–30 second range also performs well, with 70%–80% completion and a 5.8% engagement rate.
Longer formats can still work, but they usually need a clear reason to exist. 30–60 second Reels show 40%–50% completion and often do well for educational content. 60–90 second Reels drop to 28% completion, yet they generate the highest total saves and shares. That makes sense: people may not finish every longer Reel, but they often save or share the ones that teach something worth revisiting. Once Reels stretch to 90–180 seconds, completion falls below 25%, and engagement drops to 3.2%.
Captions help more than many brands expect. 80% of users are more likely to finish a Reel if captions are available, largely because many people watch without sound.
Once length is set, posting time and niche determine how well Reels turn views into growth.
Socialinsider's 2025–2026 benchmark shows that the average Instagram Reel gets 283,000 views and 182,000 reach. But the gap between industries is huge.
Media & Entertainment sits at the top across the board, with 545,000 views and 352,000 reach per Reel. Publishing comes next with 434,000 views and 280,000 reach. It also posts the highest save rates among the industries tracked.
At the other end, Wellness and Children & Baby bring in the lowest view volume, at about 54,000–55,000 views and 37,000 reach per Reel.
Engagement tells a slightly different story. Travel and Media & Entertainment both hit 0.5%, the top engagement rate in the benchmark set. Meanwhile, Fashion and Home land at 0.1%.
| Industry | Avg. Views per Reel | Avg. Reach per Reel | Avg. Engagement Rate |
|---|---|---|---|
| Media & Entertainment | 545,000 | 352,000 | 0.5% |
| Publishing | 434,000 | 280,000 | 0.4% |
| Luxury | 249,000 | 163,000 | 0.3% |
| Beauty | 138,000 | 85,000 | 0.2% |
| Food & Beverage | 126,000 | 80,000 | 0.3% |
| Retail | 125,000 | 78,000 | 0.2% |
| Travel | 98,000 | 66,000 | 0.5% |
| CPG | 96,000 | 62,000 | 0.4% |
| Fashion | 93,000 | 60,000 | 0.1% |
| Home | 92,000 | 65,000 | 0.1% |
| Wellness | 54,000 | 37,000 | 0.2% |
| Children & Baby | 55,000 | 37,000 | 0.2% |
Source: Socialinsider, 2025–2026
That range is a good reminder: format and timing still matter a lot. A niche with lower average views can still punch above its weight if the Reel is built the right way and posted when people are active.
Industry gives you one part of the picture. Length affects whether people stick around long enough to finish the Reel.
As of 2026, Instagram Reels can run up to 3 minutes (180 seconds). But the best length depends on what you want from the post.
If the goal is fast consumption and stronger completion, use 7–15 seconds for entertainment content. If you're teaching something or walking people through an idea, 20–35 seconds tends to work better.
Once you go past 90 seconds, performance drops fast. So yes, Instagram gives you more room now, but more room doesn't always mean more views, more watch time, or more engagement.
Views can shift a lot by niche, but retention still comes back to length and format. Short, clear, and easy to follow usually wins. Using free Instagram tools can help streamline this content creation process.
The first 30 to 60 minutes after posting matter most because Instagram uses early engagement signals to expand distribution.
That means timing affects how fast your Reel gets tested beyond your current followers. In plain English: if people react early, Instagram is more likely to keep pushing it.
| Day | Posting Window (Local Time) | Notes |
|---|---|---|
| Tuesday | 10:00 AM – 1:00 PM | Highest reach window |
| Wednesday | 10:00 AM – 1:00 PM | Strong for B2B and services |
| Thursday | 11:00 AM – 2:00 PM | Good initial testing window |
| Tue – Thu | 7:00 PM – 9:00 PM | Best for entertainment |
| Friday | 9:00 AM – 12:00 PM | Higher save behavior |
| Sunday | Any | Less upload competition; can produce 25,000+ views per Reel |
A few patterns stand out:
For creators, the big job is simple: focus on Instagram growth to turn non-follower discovery into repeat viewing.
Last updated: June 2026
A good Instagram Reel view count depends on your account size, niche, and industry. On average, a Reel gets about 16,153 views per post.
That said, Reels work a bit differently than regular feed posts. They’re built for discovery first, so view counts often don’t line up neatly with follower count. In fact, about 55% of Reel views usually come from non-followers.
So if you’re trying to figure out whether your numbers are good, don’t stop at views alone. Compare your performance against others in your industry. And pay close attention to metrics like reach rate - which averages 30.81% - along with watch-through rate.
In 2026, the best Instagram Reel length comes down to what you want the post to do.
15–30 seconds usually gets the most engagement. It’s short, easy to watch, and fits the way people scroll.
60–90 seconds works better when you want more saves, more shares, and enough room to tell a fuller story.
If you want one simple rule, use 15–30 seconds for quick engagement and 60–90 seconds when the idea needs more depth.
No matter how long your Reel is, the hook matters most. If the first few seconds don’t pull people in, the rest of the video won’t get much of a shot.
Yes. In 2026, Reels average 3–5x more reach than static image posts and 2–3x more reach than Stories.
That gap matters because Reels are now Instagram’s main discovery format. In most cases, more than 50% of Reel views come from non-followers, which gives brands and creators a much better shot at getting in front of new people.
The numbers back that up. Reels have an average reach rate of 30.81%. That’s more than double the reach rate of carousels, image posts, or Stories.
Reels engagement measures how many people do something with your Reel - mainly likes, comments, saves, and shares - compared with how many people it reaches.
For Instagram’s 2026 ranking system, not all signals carry the same weight. DM shares matter most for discovery. After that comes watch time, then public actions like comments and likes. So when people talk about engagement rate, they’re looking at how well a Reel turns reach and views into actual action.
Share this post&description=2026%20benchmarks%20for%20Instagram%20Reels%3A%20reach%2C%20watch%20time%2C%20engagement%2C%20top%20lengths%20(15%E2%80%9330s)%2C%20and%20best%20posting%20windows.&image=https://www.upgrow.com/blog-images/assets.seobotai.com/cdn-cgi/image/quality=75,w=1536,h=1024/upgrow.com/6a4319942902db05ecd86a21-1782783935354.jpg)


