Instagram Mobile Analytics Dashboard: 5 Checks
Five mobile checks: follower trend, top posts, audience fit, timing and first-hour response to spot growth or issues.
Five mobile checks: follower trend, top posts, audience fit, timing and first-hour response to spot growth or issues.
4.98 /5 - from 58k reviews
Trusted by 50,000+ creators — get real engagement delivered to your profile in minutes, not days.
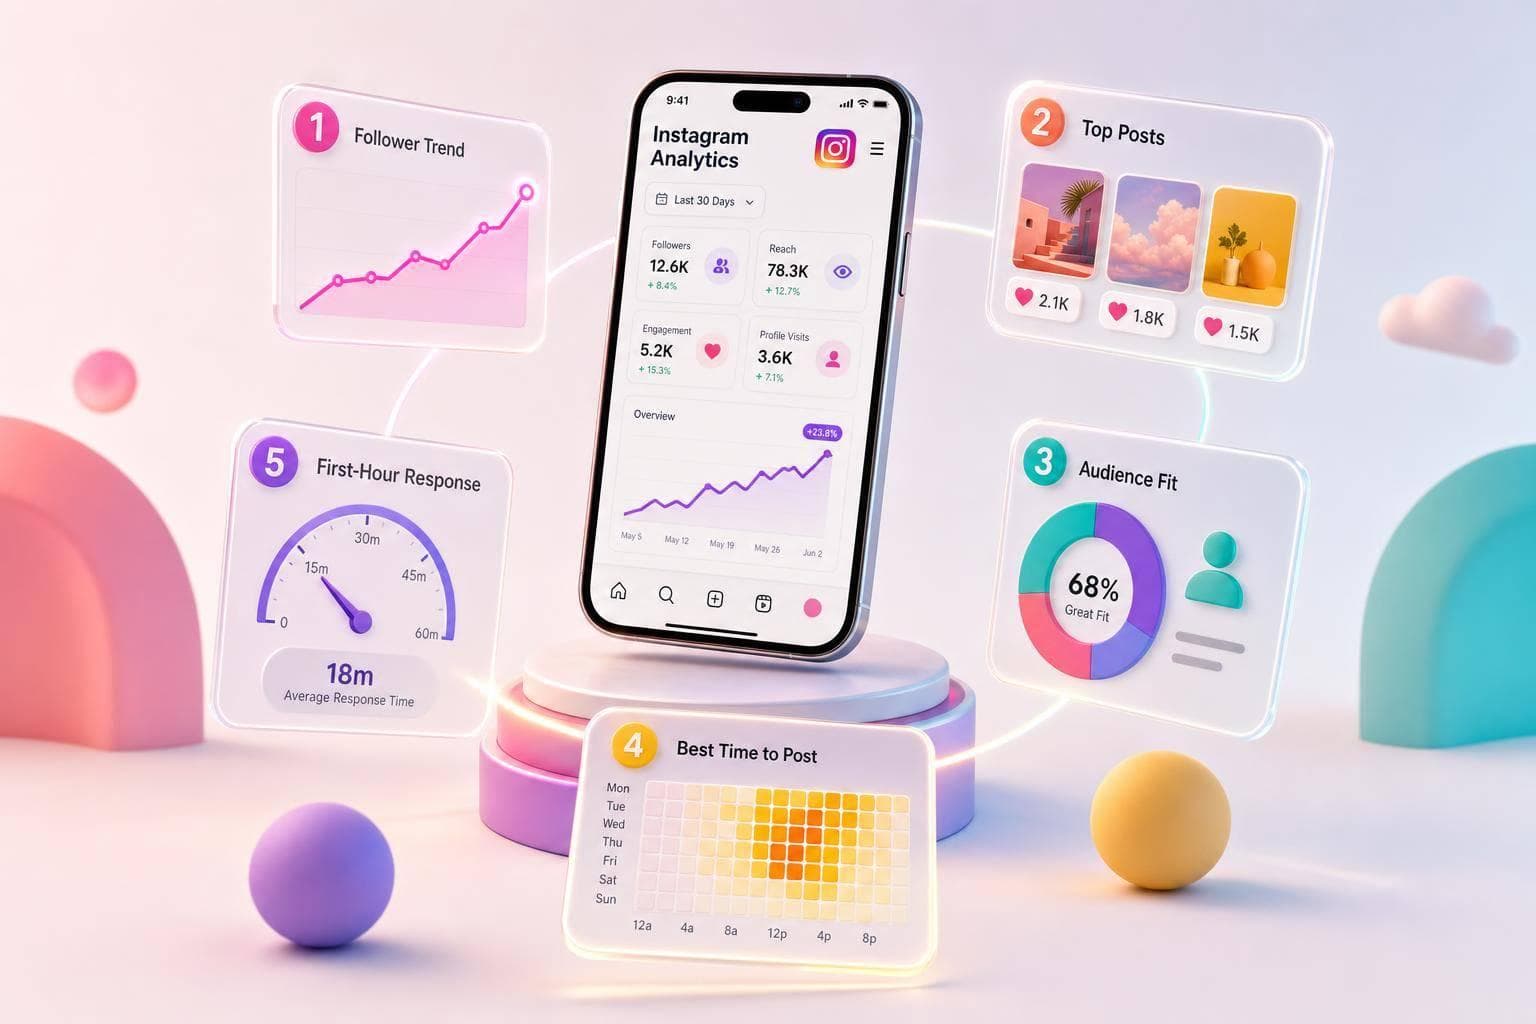
If I only have 5 minutes to check Instagram on my phone, I look at five things: net follower change, top posts, audience fit, post timing, and live response. That gives me a fast read on whether the account is moving up, stalling, or slipping.
Here’s the short version:
A few numbers matter more than others. I pay more attention to saves and shares than likes. I also flag audience shifts like a 3% to 5% change in age mix or 30% to 40% of new followers coming from non-target regions for 3 straight days.
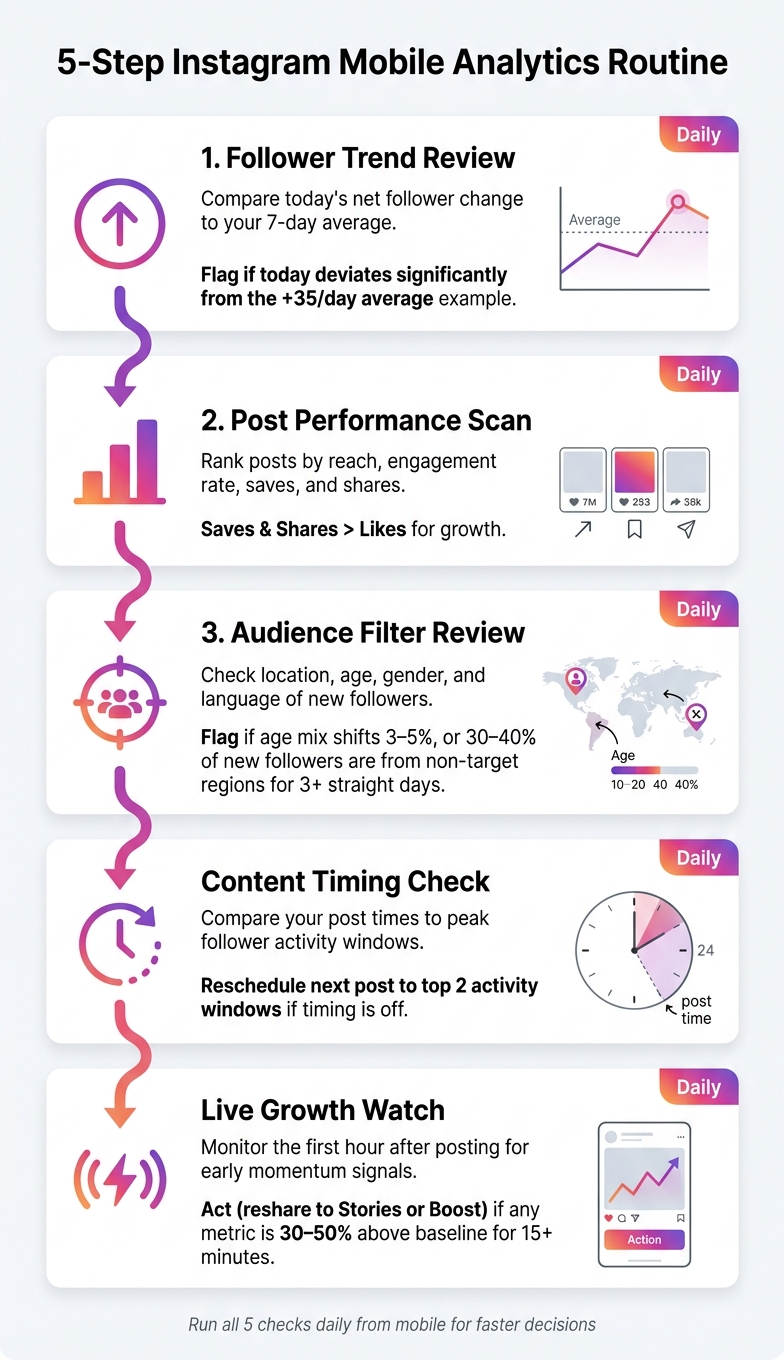
5-Step Instagram Mobile Analytics Routine (Under 5 Minutes)
| Check | What I look for | Fast action |
|---|---|---|
| Follower trend | Net change vs. 7-day average | Find what caused a spike or drop |
| Post results | Reach, engagement rate, saves, shares | Repeat the post type that worked |
| Audience fit | Location, age, gender, language | Watch for off-target growth |
| Timing | Post time vs. active hours | Move the next post into a better window |
| Live watch | First-hour reach, engagement, follower movement | Reshare or boost if the post starts strong |
This routine is simple: check the baseline, see what drove it, confirm the audience, fix timing, and watch the first-hour response.
Look at total followers, new followers, unfollows, and net follower change. Net change matters most because it shows what your account actually gained today.
Don’t judge today’s number on its own. Put it next to your 7-day average so you can tell if today was strong, weak, or just normal.
For example, if your last 7 days averaged +35 net followers per day and today comes in at +42, that’s above your usual pace. If today is only +10, that’s a sign to take a closer look.
Instagram Insights shows follower growth for the last 7 days by default on mobile, so you can make this comparison right inside the app.
Small day-to-day swings don’t always come from your content. Sometimes they’re just account cleanup.
A spike means today landed well above your 7-day norm. When that happens, check the last 24–48 hours and find the post that likely drove it. A drop, or a flat stretch, can point to an issue with content, posting cadence, or targeting.
Use that pattern to decide what to test next:
If net growth shifts, the next step is simple: find the post behind the change in your next scan.
After you look at follower trend, the next step is simple: find the posts behind the change. If follower movement went up or down, check which post likely pushed it there.
Start with reach. Then look at engagement rate, saves, and shares. Engagement rate means interactions divided by reach. It shows how strong the post was compared with the number of people who saw it.
Don’t give too much weight to likes. For growth, saves and shares matter more.
A simple way to read this:
That split matters. A post can reach a big audience and still do little for growth. Another post might reach fewer people but earn a lot of saves and shares, which is often a stronger sign.
Compare each format by the job it’s supposed to do. Reels often drive the most reach and shares. Carousels often get the most saves, especially for educational or reference-style posts. Stories make more sense when judged by completion rate and replies, not just reach.
If one format keeps pulling in more reach while another keeps earning more saves and shares, use that split on purpose. Pick the format based on the goal of the next post: reach or depth.
And if a format keeps looking weak, don’t assume the format itself is the problem right away. Check your reporting filters first. Sometimes the pattern isn’t bad data from the posts. It’s just the wrong view hiding what’s going on.
Once you know which posts did the best, the next step is simple: who actually saw them? On mobile, the fastest way to check is through your audience filters. A bigger audience can look good on paper. But filters tell you whether that growth is reaching the right people.
Keep location, age, gender, and language in view. These filters show whether your growth lines up with your target audience.
Location shows where new followers are coming from, whether that's the U.S. as a whole or specific states and cities. If a new country or city shows up in the list, flag it.
Age and gender show whether your audience mix still fits your target. If you see a sharp gender shift after a post or a collaboration, take a closer look.
Language can help when your dashboard tracks it. It’s useful for spotting when bilingual or localized content may be needed. Native Instagram Insights may not show language data clearly, so only check this when your dashboard includes it.
Use daily checks to make sure the audience still fits. Then review filter shifts on a weekly basis.
A few changes are worth flagging for later review:
That last one matters. One off-day is just noise. Three days in a row starts to look like a pattern.
When the audience mix stays steady, move on to timing and check whether you're posting when followers are most active.
The next question is simple: are you posting when your audience is online? Timing won’t fix weak content. But if you keep posting at the wrong times, even strong posts can lose steam.
Use your dashboard’s follower activity chart to spot your audience’s peak hours in local time. You’ll usually see activity climb during a few repeat windows. The key point is this: your audience sets the pattern. Don’t assume there’s one best time for everyone. Similarly, you should determine how often to post to maintain consistency without overwhelming your followers.
Look at your last three to five posts and write down the publish time for each one. Then compare those times with the peak activity bars on your chart. Aim your next post at one of your top two activity windows. If most of your recent posts landed outside those windows, mark that as a problem and shift the next scheduled post.
Post shortly before your strongest activity window starts. If the timing looks off, change the next post or schedule Instagram posts for better windows before they go live.
If two or more of your last three posts were published during low-activity periods, that’s a clear enough signal to move the next one. Put it into the strongest window shown on your chart. For example, if you posted at 3:00 PM but your clearest peak is in the evening, reschedule it for 7:30 PM.
Use live activity data to catch weak scheduling before the post goes out.
After the timing check, move to live growth watch to see whether the post is actually speeding up follower growth.
Once your post is live, don’t just publish and walk away. Check the live data to see if it’s picking up steam. The first hour matters most, because early engagement can help push your post to more people.
In that window, watch three signals: follower change, fast engagement, and reach and impressions. If any one of those metrics comes in 30% to 50% above your baseline for at least 15 minutes, that’s a sign you should act on. Reshare the post to Stories or use Boost™ to keep the momentum going. If unfollows jump after a post, adjust the angle on the next one.
UpGrow's live dashboard tracks follower changes and engagement in real time.
Use the live watch to see if the earlier checks are turning into Instagram growth. Each check builds on the one before it: baseline, performance, audience, timing, and live response. Run all five each day from mobile so you can make faster calls.
A good net follower change usually points to a healthy growth rate of about 2.5% to 5%. The key is to watch net growth, not just raw follower counts.
Here’s the simple math: subtract lost followers from new followers gained. That number gives you a much clearer read on account health and audience retention.
A steady, organic climb matters more than a sudden spike. Big jumps can look nice on the surface, but consistent growth usually tells you more about whether people want to stick around.
No single metric should run the whole show. For Instagram growth, pay closer attention to saves and shares than likes, because they show stronger audience interest and often have more impact on reach.
It also helps to track follower growth rate, reach, and engagement velocity in the first 60 to 90 minutes after you post. That early window can tell you if a post is picking up steam, so you can make real-time changes if needed.
If a post is already doing well on its own, that’s often a good sign it can go farther with paid support.
Check your analytics dashboard and look for posts with strong engagement, especially saves and shares. When you boost content that’s already getting traction, you give it more room to spread and build on that momentum.