Instagram Follower Quality Scoring: Ultimate Guide
Score and audit Instagram followers by authenticity, engagement, audience fit, and growth with an actionable workflow.
Score and audit Instagram followers by authenticity, engagement, audience fit, and growth with an actionable workflow.
4.98 /5 - from 58k reviews
Trusted by 50,000+ creators — get real engagement delivered to your profile in minutes, not days.
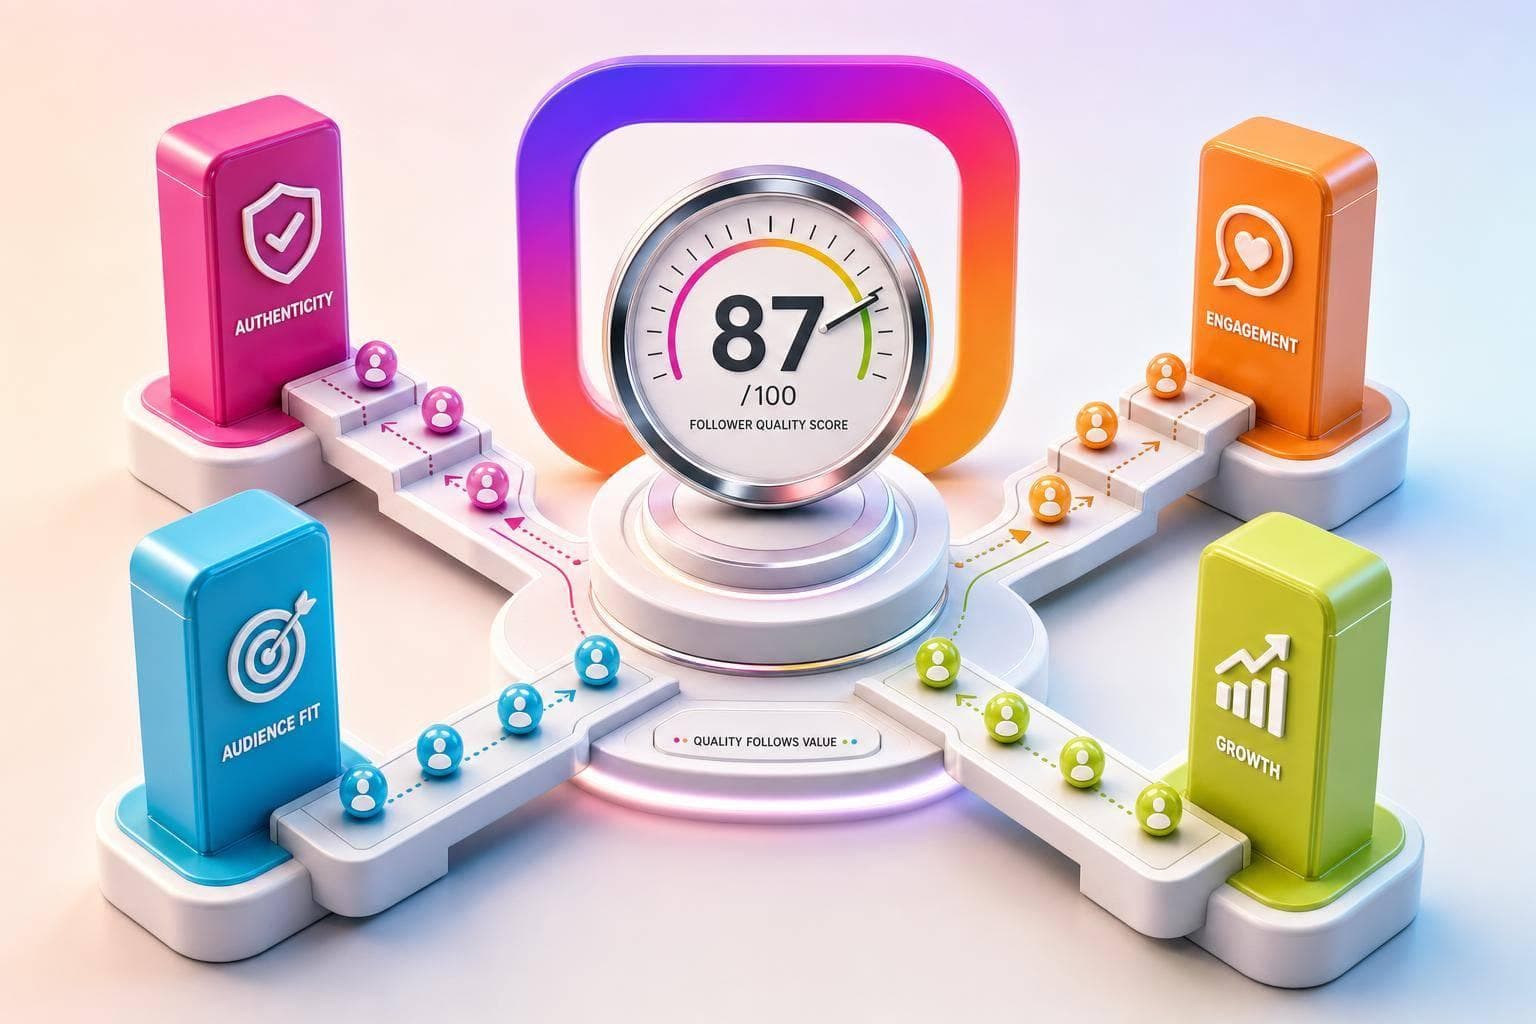
A big Instagram following can still be low value. If fake, inactive, or off-topic followers pile up, engagement drops, conversions fall, and brand deals lose worth.
Here’s the short version: follower quality scoring checks who follows you, how they engage, whether they fit your market, and how your audience grows over time. Instead of looking at follower count alone, I’d look at four parts:
The numbers in the article make the point fast:
So if I were judging an account, I would not stop at one score. I’d use the top-line rating to screen fast, then check the lower parts to find the problem: weak audience fit, spam followers, poor content match, or bad growth sources.
A simple way to read scores:
| Score | What it means | What I’d do |
|---|---|---|
| 85–100 | Very strong audience quality | Put first for brand deals and repeat what works |
| 70–84 | Good | Safe for most campaigns; tune targeting |
| 55–69 | Mixed | Test first and check weak spots |
| 40–54 | Weak | Limit spend and perform an Instagram audit |
| 0–39 | Poor | Avoid big deals and rebuild audience quality |
I’d also judge scores by niche and size. A fitness page can support higher engagement than fashion. A local food account should have a strong share of followers from its city. A travel creator can still score well with a global audience if saves, shares, and follower quality stay strong.
At the working level, the article’s process is simple: score, check sub-scores, sample followers by hand, review recent engagement, compare audience data to your market, and log changes each month. That gives you a clean way to spot trouble early and fix it before you waste time or money.
If your follower count is up but engagement is down, that’s the warning sign I’d treat first.
AI audits usually give each account a 0–100 score built from weighted sub-scores like engagement, authenticity, audience match, and growth stability. But the score itself is just the shortcut. The part that matters is the data underneath it.
The model looks at much more than engagement rate. It checks follower-to-following ratios, growth consistency over time, comment quality, profile completeness such as bio, profile photo, and posting history, plus audience geography and language fit. For niche accounts, that fit should line up with the market you actually want to reach.
It also puts the most weight on deeper signals. Saves, shares, completion rates, and DM shares per reach tend to show real interest better than likes. A like is easy. A save or share usually means the content meant something.
AI detection works by spotting patterns and outliers. The clearest warning signs are empty profiles: no bio, no profile photo, and few or no posts. Add a random-looking username, and the account starts to look suspicious fast.
Another common flag is mass-following behavior. If an account follows thousands of users but gets almost nothing back, the model reads that as a weak sign. Comment scanning also helps. Generic, repeated phrases like "Nice pic!" or emoji-only replies posted across many accounts in a short time window often point to low-quality activity.
Growth spikes stand out too. Time-series analysis catches sharp jumps in follower count that fall outside the account’s normal trend. When that happens, the model lowers both the growth stability and authenticity sub-scores.
For U.S.-targeted accounts, location mismatches are another clear flag. If a brand is trying to reach U.S. buyers but has large follower clusters from places unrelated to that market, something is off. And bot-sourced followers don’t stick around for long. Their 90-day retention rate is just 15–40%, compared with 85–95% for real, managed accounts.
The composite score works best as a quick screening signal. It gives you one number to track month over month or use as a minimum bar when you connect with influencers for deals. For example, a U.S. retailer might require a composite score of 70 or higher before putting money into a collaboration.
That said, sub-scores matter when the top-line number hides a trade-off. A low audience match score points to a targeting issue. A weak authenticity score points to cleanup. A low growth stability score suggests it’s time to review acquisition.
Use the composite score to screen fast. Then use the sub-scores to figure out whether the problem is audience mix, content, or acquisition.
Use the score bands next to turn those sub-scores into action.
A raw 0–100 score only helps if it leads to a clear call. The easiest way to do that is to sort scores into five bands:
| Score Range | Label | Recommended Action |
|---|---|---|
| 85–100 | Excellent | Prioritize for key partnerships; replicate what's working |
| 70–84 | Strong | Safe for most collaborations; fine-tune targeting |
| 55–69 | Average | Run test campaigns; diagnose audience quality issues |
| 40–54 | Below Average | Limit investment; audit followers and reset growth tactics to increase engagement on Instagram |
| 0–39 | Poor | Avoid major partnerships; rebuild audience from the ground up |
Use 85+ for priority partnerships, 70–84 for standard collaborations, and 55–69 for testing and diagnosis.
That split matters more than it may seem at first glance. Accounts with 25% or more fake followers see 83% lower engagement per real follower, and campaigns aimed at audiences with over 30% fake followers see conversion rates drop by 58%. So a score isn’t just a label. It points to risk, spend, and whether a partnership is worth the shot.
After that, bring in niche and account size. A score that looks strong in one space can look weak in another.
Start with the score band, then layer in niche context.
Fitness usually supports higher engagement. In this category, 3%–4% can fall into Average or Strong, while 5%–7%+ can land in Excellent. Fashion tends to run lower. Fashion influencers average about 3.6%–3.65%, while fashion brands sit closer to 1.5%. In both cases, comment quality still counts. A post full of generic replies can make engagement look better than it is.
Food accounts, especially local restaurants and cafés, should be judged less by raw follower count and more by location fit. For local food brands, local reach beats broad reach. That means an Excellent score should usually require 50%–70% of followers from the target city or metro area, which ties straight back to the audience fit input in the scoring model.
Travel creators are a different story. They often pull in a broad international audience, and that alone isn’t a red flag. A global audience is fine if authenticity signals stay strong and engagement shows real intent, especially through saves, shares, and DMs. A travel account can still score Excellent with followers spread across countries if bot signals stay low.
Tracking essential Instagram metrics across different account sizes matters too. Smaller accounts can often hold higher engagement rates than larger ones. If you use the wrong benchmark for the wrong audience tier, it’s easy to read follower quality the wrong way.
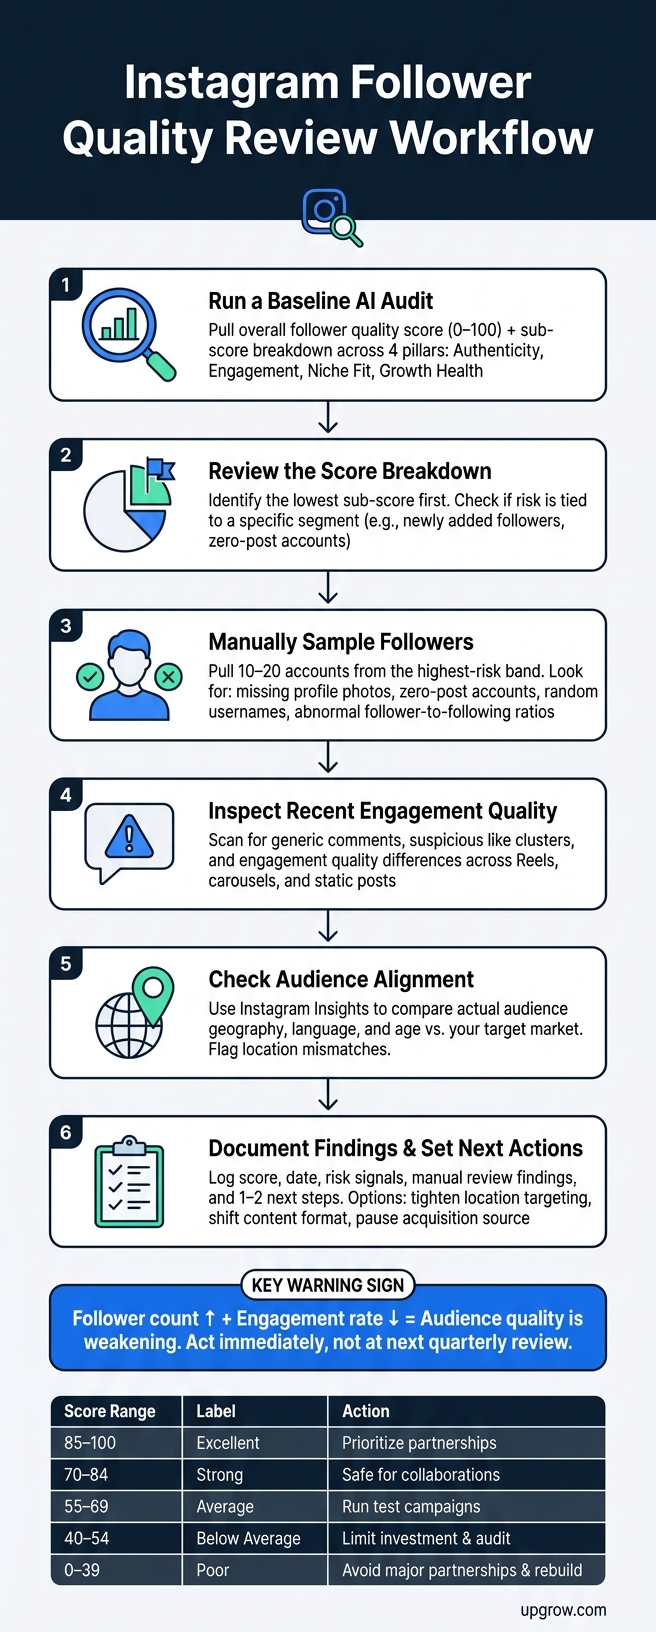
Instagram Follower Quality Review Workflow: From Audit to Action
Once you have a score band, use a simple review process to figure out why the score landed there and what to do next.
Start with the score, then confirm the issue with a quick manual check. The main thing is consistency. Run the same monthly or quarterly process each time so you can compare changes over time.
Run a baseline AI audit
Pull an overall follower quality score, along with a breakdown across the four pillars: authenticity, engagement, niche fit, and growth health. This should show where the risk is piling up, whether that's low-engagement clusters, location mismatches, bot-like behavior, or recently added low-quality profiles.
Review the score breakdown
Check the lowest sub-score first. In many cases, that's where the issue starts to show itself. See whether the risk is tied to a certain segment, like newly added followers or accounts with little to no posting history.
Manually sample followers
Pull 10 to 20 accounts from the highest-risk band and verify what the model flagged. You're looking for obvious warning signs: missing profile photos, zero-post accounts, random usernames, and follower-to-following ratios that don't line up with normal user behavior.
Inspect recent engagement quality
Look at recent posts and scan for generic comments, suspicious like clusters, and differences in engagement quality across Reels, carousels, and static posts. Sometimes one format pulls in a much weaker audience than the others.
Check audience alignment
Use Instagram Insights to compare your actual audience geography, language, and age with your target market. If you're a U.S.-focused brand, a solid share of followers should be in the United States, not scattered across unrelated regions.
Document findings and set next actions
Log the score, the date, the main risk signals, what the manual review confirmed, and one or two clear next steps. That might mean tightening location targeting, shifting content format, or pausing a certain acquisition source. A short recurring log makes month-over-month comparisons much easier and helps tie follower quality changes back to specific growth moves.
Then keep those same signals in one dashboard and review them each month.
Track the numbers that lead to decisions, not just the ones that look nice in a report.
| Metric | Why It Matters | What Should Trigger a Review |
|---|---|---|
| Overall score and month-over-month change | Tracks audience health level and direction | Sharp decline or stall after adjustments |
| Authentic vs. suspicious follower share | Shows whether growth is coming from real users or risky accounts | Suspicious share rises materially |
| Engagement rate by content type | Reveals whether Reels, carousels, or static posts attract different audience quality | Sharp divergence across formats |
| Growth trend | Distinguishes organic growth from bot-driven spikes | Sudden unexplained jump or rapid churn after a spike |
| Audience location mix | Verifies that followers match your target market | Geography shifts away from your target region |
Growth trend plus engagement rate is the clearest warning sign. If follower count goes up while engagement rate falls, that's something to check right away, not at the next quarterly review. That pattern often tells you the audience is getting bigger on paper while getting weaker where it counts.
Use audit results to tighten targeting before your next growth push.
UpGrow is an AI-powered Instagram growth service built to attract real, relevant followers. Its AI targeting, live analytics, and Instagram-compliant growth fit neatly into this review workflow. If an audit shows a geographic mismatch or weak engagement quality, you can adjust targeting filters based on that finding. The analytics help you see whether audience quality is getting better or starting to slip, and the Boost™ tool can help support recovery after a cleanup.
After the audit, turn the score into a fix. A score without action is just noise.
Each part of the score points to a different lever. Read the pattern, then match it to the fix.
After cleanup, reset benchmarks against fraud-free medians, not blended averages - for example, 2.15% for micro-influencers (10K–50K followers) and 1.12% for macro-influencers (100K–1M followers).
| Score Outcome | Likely Cause | Recommended Next Step |
|---|---|---|
| Low authenticity score | Bot, fake, or ghost followers | Run a follower audit; tighten audience filters; review acquisition channels; remove or restrict obvious spam accounts |
| Weak engagement, high authenticity | Content or audience mismatch | Test Reels vs. static posts or carousels; adjust posting times; review topic relevance and shareability |
| High overall score, high authenticity, high engagement | Current targeting and content are aligned | Scale what works and test new formats |
| Mixed quality / uneven audience fit | Some good-fit followers, some weak ones | Retarget high-quality segments; clean up low-quality followers on a schedule |
| Declining score over 3–6 months | Audience quality is drifting | Review acquisition channels; tighten filters; re-evaluate partnerships and campaigns |
If Reels outperform static posts by 2–3x among quality followers, shift more output to video and keep testing carousels and static posts.
Once you know which lever to pull, set the metric that shows whether the fix actually worked.
Track metrics tied to audience quality and business results.
A practical U.S. KPI set looks like this:
Weekly checks catch spikes. Monthly reviews compare trends. Quarterly audits cover full authenticity checks, cleanup, and targeting resets.
Follower count is a weak signal. Look at authenticity, engagement depth, niche fit, and growth health to set benchmarks. Then treat every score drop as a targeting, content, or acquisition issue to diagnose and test again.
Strong scoring models use more than one signal. Niche context also changes the baseline. A nano-influencer at around 3.42% engagement is in a strong spot, while a macro-influencer should be judged against a lower fraud-free median of 1.12%. Benchmarks only mean something when they match your tier and industry.
Treat scores as inputs for decisions, not numbers to paste into a report. The loop is simple: score, diagnose, act, verify. That’s what separates teams that grow with intent from teams that only get bigger on paper.
Check follower quality scores monthly to make sure your audience stays high quality and aligned with your growth goals. It’s also smart to review them before you lock in any influencer partnerships.
Daily checks help you track net follower changes and short-term engagement trends. Monthly reviews show the bigger picture, including shifts in audience quality over time. If you’re running influencer campaigns, do these checks at least every 90 days.
Yes. A small account can score higher.
That’s because follower quality isn’t based on follower count alone. It comes from signals like profile completeness, account age, follower-to-following ratio, posting patterns, and engagement quality.
UpGrow’s AI scoring also flags suspicious patterns. So a smaller account with a highly engaged audience can beat a larger account with weaker or diluted engagement.
If your follower count keeps going up while engagement slips, start by checking audience quality. A bloated follower list can hurt more than it helps. Ghost accounts, bots, and inactive profiles can drag down your engagement rate and make it harder for your posts to reach people who might actually care.
Use an AI-driven audit tool to spot red flags, like accounts with no profile pictures, random-character usernames, or huge following counts paired with zero followers. From there, tighten your targeting filters so new followers are active, relevant, and actually interested in what you post.