Instagram Algorithm Shifts 2026: 7 Growth Fixes
Restore Instagram reach by prioritizing Reels, tightening hooks, optimizing profiles, using keywords, testing, and staying consistent.

Instagram reach is down, but most drops come from a few trackable problems. In 2026, average organic reach sits around 3.50%, and the biggest ranking signals are now watch time, completion rate, shares, saves, profile visits, and replies.
If I were fixing a drop today, I’d start with one question: where did the drop happen first?
Here’s the short version:
- Reach fell: I’d check my content mix and put more weight on Reels
- Reels stalled: I’d fix the hook, video length, and posting window
- Stories dropped: I’d tighten the Story sequence and watch exits and replies
- Follower growth slowed: I’d clean up my bio, pinned posts, and Highlights
- Discovery weakened: I’d swap broad hashtag blocks for keyword-led captions and 3–5 niche hashtags
- Posts stayed flat: I’d test one variable at a time for 48–72 hours
- Results bounced around: I’d lock in a steady posting and engagement rhythm for 30 days
A few numbers matter more than likes now:
- Reels with ~70%+ average watch time tend to get more discovery
- DM share rate above ~3% of reach can lead to much more distribution than posts under 1%
- Story completion around 70%+ is a good sign
- Story exit rate above 25% often points to a weak frame
- A lasting 20%–40% drop over 30 days is more than normal fluctuation
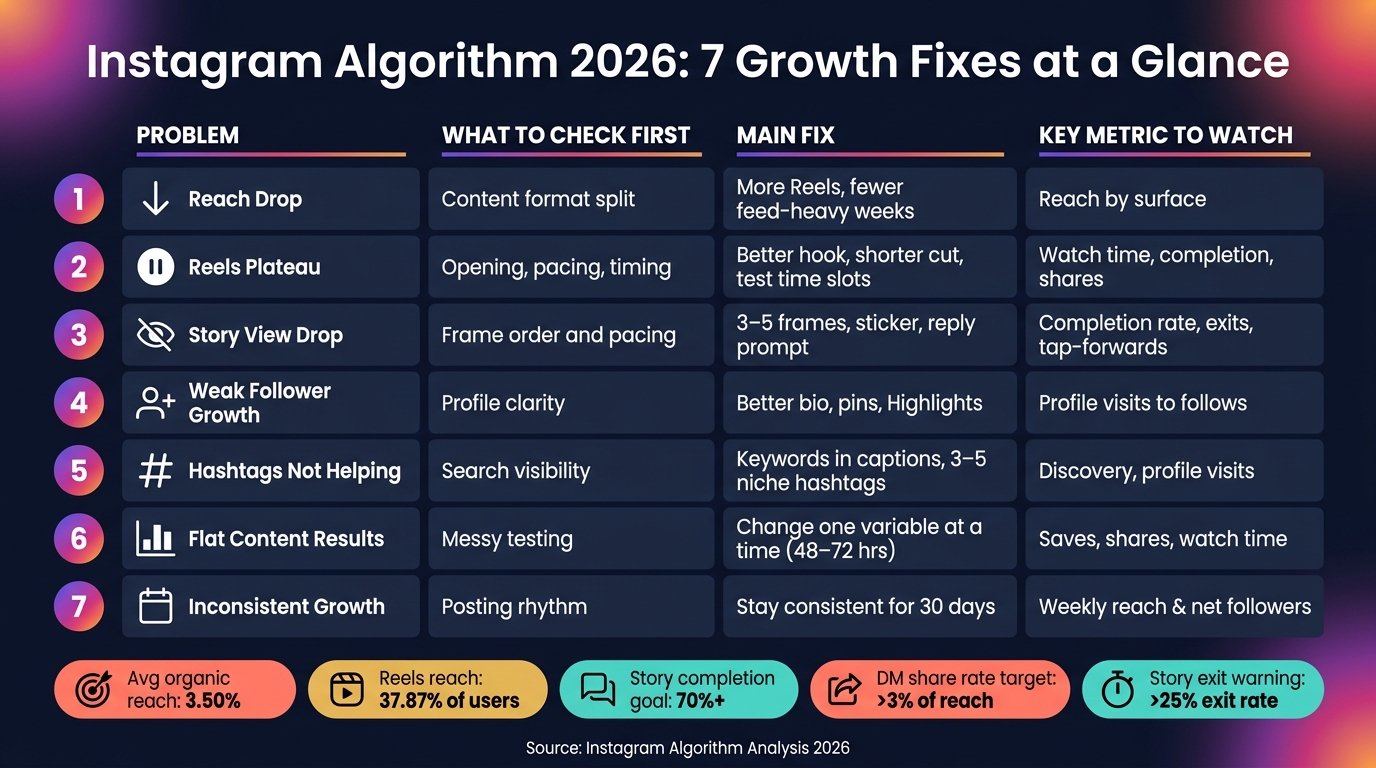
Instagram Algorithm 2026: 7 Growth Fixes at a Glance
Instagram Changed Everything Again: New Updates You Need to Know in 2026
sbb-itb-3c55afb
Quick Comparison
| Problem | What I’d Check First | Main Fix | Metric to Watch |
|---|---|---|---|
| Reach drop | Content format split | More Reels, fewer feed-heavy weeks | Reach by surface |
| Reels plateau | Opening, pacing, timing | Better hook, shorter cut, test time slots | Watch time, completion, shares |
| Story view drop | Frame order and pacing | 3–5 frames, sticker, reply prompt | Completion, exits, tap-forwards |
| Weak follower growth | Profile clarity | Better bio, pins, Highlights | Profile visits to follows |
| Hashtags not helping | Search visibility | Keywords in captions, lighter hashtag use | Discovery, profile visits |
| Flat content results | Messy testing | Change one thing at a time | Saves, shares, taps, watch time |
| Inconsistent growth | Posting rhythm | Stay consistent for 30 days | Weekly reach and net followers |
So if your Instagram growth dipped, I wouldn’t guess. I’d analyze the data by Feed, Reels, Stories, and Explore, match the drop to the right issue, and fix that first.
Fixes 1-2: Reach Drops When Your Content Mix and Reels Execution Are Off
1. Reach fell because your posting mix is too feed-heavy
If your weekly mix leans too hard on feed posts, move more of your discovery effort to Reels. They put your content in front of far more nonfollowers than static posts do. Reels reach an average of 37.87% of users, while Stories reach only about 3.13%.
For many U.S.-based accounts, a solid starting mix is 4–6 Reels, 2–3 carousels, and daily Stories.
Here’s why that mix works:
- Reels help you get in front of new people
- Carousels drive saves and deeper engagement
- Stories help keep current followers warm and active
Carousels matter too. Metricool found that carousels had the highest engagement rate at around 10.15%, compared with Reels at 6.27%. So while Reels help with reach, carousels often do more of the heavy lifting when you want people to slow down, read, and save.
| Format | Visibility | Best Use Case | Primary Ranking Signal |
|---|---|---|---|
| Reels | Reels feed, Explore, recommendations | Discovery, top-of-funnel growth | Watch time, completion rate, shares |
| Carousels | Main feed, occasional Explore | Education, storytelling, saves | Dwell time, saves, comments |
| Stories | Home screen for current followers | Retention, relationship-building | Reply rate, tap-forwards vs. exits, return visits |
2. Reels views plateau because hooks, length, or timing are weak
Once Reels become your main discovery format, the next step is tightening the parts that make people stop and watch: the hook, the length, and the posting window.
A weak hook can kill a Reel fast. If the opening feels slow, unclear, or too polished in the wrong way, people swipe. And if enough people do that early, the Reel can stall after Instagram shows it to its first test audience.
Start with the hook. The first frame should make the payoff clear in the first second. On-screen text like 3 posting mistakes killing your reach is much stronger than a logo intro or a slow camera pan. People should know, right away, why they should keep watching.
Then look at length. For fast tips, lists, or do/don’t content, 7–15 seconds often works well. For slightly deeper topics, 20–30 seconds is usually enough. If there’s dead air, trim it. If a sentence drags, cut it. A Reel should feel tight, not padded.
Only test timing after you’ve fixed the hook and length. Otherwise, you’re testing the wrong thing. These are three common U.S. posting windows to start with:
| Weekdays | Posting Window | Dominant User Behavior |
|---|---|---|
| Monday–Friday | 7:00–9:00 AM | Morning scroll |
| Monday–Friday | 11:30 AM–1:30 PM | Midday scroll during lunch breaks |
| Monday–Friday | 6:00–9:00 PM | Evening unwind with more time to watch multiple Reels |
A simple way to test this: post the same Reel concept in two different windows over the course of a week, then stick with the slot that gets the better reach and completion rate.
Fixes 3-5: Engagement Slips When Stories, Targeting, and Hashtags Miss the Mark
3. Story views are down because your Story sequence loses attention
If Reels reach is holding steady but engagement is slipping, Stories are the next place to look.
In 2026, Stories are ranked by recency, relationship strength, and actions like replies, sticker taps, and profile visits. Put simply: back-and-forth actions matter more than passive views.
That means the first frame has to do some heavy lifting. Lead with the payoff right away, like "3 things hurting your reach right now," so people know what they’ll get. Then keep each frame tight and focused on one point. Big blocks of text usually make people tap forward or leave.
A simple setup works well:
- Use 3–5 frames
- Add one interactive sticker in the middle
- End with a reply prompt
Check Story Insights about 72 hours after posting. A completion rate of around 70% or higher is a strong sign. Anything under 50% often means the sequence is too long or drifts in the middle. If exit rate jumps above 25% on a frame, that frame is likely pushing people out. And when tap-forwards spike, that usually means the frame feels slow, repetitive, or a little off-track.
In that case, trim the copy, remove the frame, or push that point later in the sequence.
4. Follower growth is weak because your profile attracts the wrong audience
Weak follower growth usually comes back to profile clarity, not content quality. If your bio is vague, your Highlights feel generic, or your pinned posts miss the topic people came for, visitors leave without following.
The issue is pretty common. Some bios lean too hard on personality and not enough on what the account helps with. Some Highlights are labeled "Random" or left blank. Some pinned posts don’t show the best work or the clearest entry point. When that happens, the profile stops doing its main job: showing people who you help and why they should stick around.
A cleaner setup looks like this:
- A clear bio
- Labeled Highlights
- Three pinned posts: your best work, your main offer, and one useful explainer
Search also matters more now. In 2026, Instagram Search indexes keywords from captions, bios, names, and alt text, not just hashtags. So if you’re a Dallas-based fitness coach, putting "Dallas fitness coach" in your name can help you show up in the right searches.
You can also use UpGrow's AI targeting and profile optimization tools to bring in followers who fit your niche.
Once your profile lines up with your niche, using Instagram SEO tips makes your posts easier to find.
5. Hashtags stopped working because your keyword strategy is outdated
If profile visits are up but discovery still feels weak, your keyword strategy may be behind the times.
A lot of people still paste the same 25–30 hashtags on every post. That move has mostly lost its punch. Instagram's 2024–2026 spam filters have flattened the lift from high-count hashtag blocks.
At this point, hashtags do more to sort posts into a niche than to drive broad discovery.
The better move is pretty simple: use 3–5 niche-specific hashtags for most posts, rotate them based on the post type, and write captions in plain language with natural keyword phrases. Think tutorials, case studies, and behind-the-scenes posts each getting their own tag set.
For example, a caption like "Here's a 3-step Reels script small business owners can use to turn views into profile visits" can do more for discovery than a generic hashtag block, because Instagram now indexes the words in your caption directly.
It’s also smart to review hashtag sets on a regular basis and remove suppressed tags. Those can cut reach by more than 22%.
Fixes 6-7: Growth Stalls Without Structured Testing and Consistency
6. Content performance is flat because you are not testing one variable at a time
When reach drops after an algorithm shift, most people panic and change everything at once. They swap the hook, cut the video, rewrite the caption, and post at a new time. That feels productive, but it creates a mess. If results change, you can't tell what helped and what hurt.
The better move is simple: change one thing at a time. Then watch the data for 48–72 hours before you test the next variable.
Pick one element to test, like your hook style, video length, caption format, cover text, or CTA. Make two versions. Keep the rest the same: same topic, same basic structure, and a similar posting window. Then track watch time, saves, shares, profile taps, and CTA actions for each version. After 48–72 hours, choose the winner and use that pattern in your next 3–5 posts before moving on to another variable.
Here’s a simple framework:
| Variable | Version A | Version B | Key Metrics |
|---|---|---|---|
| Hook style | Curiosity: "You're posting Reels wrong in 2026…" | Benefit-first: "Do this to double Reels reach in 30 days" | 3-second view rate, watch time, shares |
| Video length | 12–15 seconds | 28–35 seconds | Completion rate, average watch time, saves |
| Caption format | Short narrative story | Bullet-point steps + CTA | Saves, comments, profile taps |
| Cover text | Plain label ("Meal prep hack") | Outcome-focused ("Save 3 hours a week") | Profile grid taps, watch starts |
| CTA style | Soft: "Save this for later" | Direct: "Comment 'GUIDE' and I'll DM you the checklist" | Comments, DMs, saves |
Stick with the winning version for 3–5 posts before you test the next variable. That’s how you get clean signals instead of guesswork.
7. Results stay inconsistent because your posting and engagement rhythm is sporadic
Once you find something that works, the next job is to stay steady long enough to trust the numbers.
If your posting rhythm is all over the place, Instagram gets a shaky read on how people respond to your content. A good baseline is 3–4 Reels a week, 1–2 feed posts, and daily Stories. On top of that, add two to three 20–30 minute engagement blocks during weekdays to reply to comments, answer DMs, and spend time with your audience's content. That keeps strong signals moving without wearing out your team.
One timing note matters here: avoid the 2 AM–5 AM window. Engagement drops by 31% during those hours.
For agencies handling multiple accounts, this same baseline works for each client. A content calendar helps you batch themes ahead of time, while still leaving space for reactive posts when trends shift. UpGrow's 24/7 real-time monitoring shows when a client's reach or follower growth slips below normal, so you can adjust posting frequency or content mix fast instead of spotting the drop days later. The Boost™ tool can also help during key windows, like a product launch, so you’re not asking one Reel to do all the heavy lifting.
Keep that rhythm in place for 30 days, then compare results week by week.
Conclusion: A 30-Day Plan to Recover Instagram Reach and Follower Growth
Use the seven fixes as a 30-day reset. Start by getting reach back on track, then work on follower quality. If reach slips, go back to the spot where the drop began: content mix, Reels, Stories, profile, keywords, testing, and then posting cadence. That order matters because each fix gives you a cleaner read on the next one.
Split the month into four weekly sprints. In Week 1, audit your posts, tighten up your Instagram profile, and rebalance your content formats. In Week 2, test Reel hooks and posting windows. In Week 3, rebuild your Stories flow and update your keyword and hashtag use. In Week 4, stick to one-variable testing and settle into a steady publishing rhythm. Track performance with the metrics below.
| Metric | Review Frequency |
|---|---|
| Reach (total and per post) | Weekly |
| Reels watch time and completion rate | 24–72 hours after each post |
| Saves and shares | 24–72 hours after each post |
| Story exits and sticker interactions | Twice per week |
| Profile visits and link taps | Weekly |
| Net follower growth | Weekly |
One metric to watch from Day 1 is first-hour like velocity. If a post gets 5% of its final 24-hour like count in the first 60 minutes, it is 4.1x more likely to land on the Explore page. That gives you an early signal that the post has momentum.
UpGrow's AI targeting and live dashboard can filter new followers by location, age, gender, and language while tracking day-by-day reach and growth.
FAQs
How do I know which Instagram metric to fix first?
Compare your results against current benchmarks and look for the clearest warning signs first.
Start with sends-per-reach (DM shares). This is the strongest signal for non-follower discovery, so it deserves your attention before likes do. If it drops below 0.3%, put your energy into making your content more shareable.
Keep an eye on these numbers too:
- A reach-to-follower ratio below 8% for creators or 5% for businesses
- A save rate under 0.5%
Treat these as higher-priority signals than likes, since they show active engagement and stronger interest from your audience.
What is a good Reels watch time in 2026?
A good 2026 Reels watch time benchmark is getting 60% or more of viewers to stay past the first 3 seconds. Instagram uses that early retention signal to help decide how far to distribute your Reel.
If viewers drop off hard after 4–8 seconds, retention probably isn’t strong yet. In that case, your hook likely needs work.
How long should I test before changing strategy again?
After you apply a fix for a reach drop, give it 7 to 14 days before you change anything else. That gives Instagram’s signals time to settle.
If you’re doing a formal reset for an originality penalty, the timeline is usually longer. In that case, recovery can take 14 to 21 days.
Try not to change everything at once. It’s better to use weekly check-ins for small adjustments, then zoom out and review 90-day periods to catch bigger patterns.