How to Track Instagram DM ROI in 2026
Track Instagram DM profitability by measuring reply, lead, and sale rates, tagging revenue, logging costs, and reviewing weekly.
Track Instagram DM profitability by measuring reply, lead, and sale rates, tagging revenue, logging costs, and reviewing weekly.
4.98 /5 - from 58k reviews
Trusted by 50,000+ creators — get real engagement delivered to your profile in minutes, not days.

If you can’t tie Instagram DMs to sales, you don’t know if they’re making money or just eating up hours.
I’d track DM ROI with one simple system: define the funnel, tag revenue sources, log costs, and check one dashboard every week. In plain terms, that means I’d measure reply rate, lead rate, sale rate, average order value, revenue per DM, and then use the ROI formula: (revenue - cost) ÷ cost × 100%.
Here’s the full idea in a few lines:
A simple example makes the point fast: if DMs bring in $25,000.00 and cost $5,000.00, ROI is 400%. If you miss promo-code sales or staff time, that number can be off by a lot.
What I like about this system is that it keeps the question simple: Did these conversations produce more money than they cost? That’s the number I’d use to judge DM work in 2026.
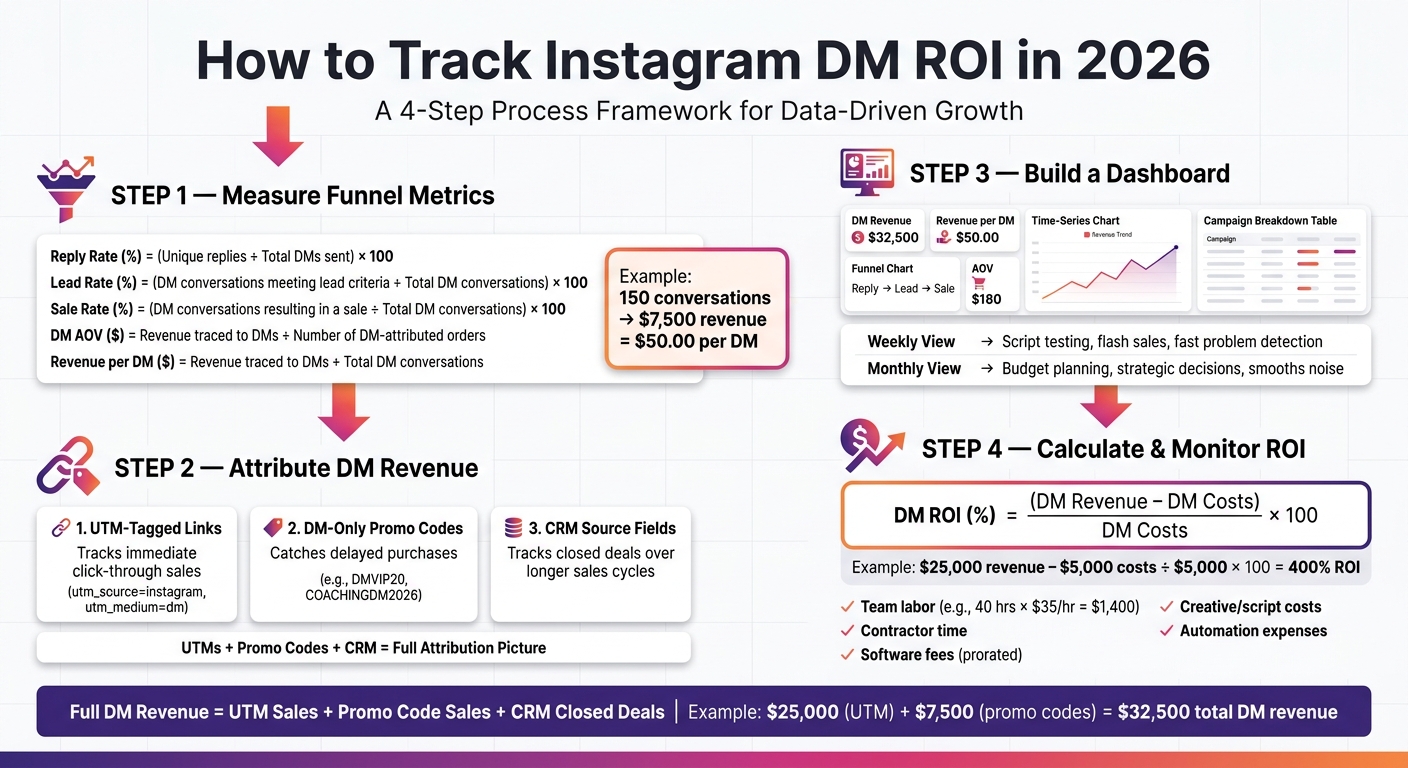
Instagram DM ROI Tracking System: 4-Step Framework
Once your metric definitions are set, it’s time to run the numbers. These four calculations sit at the heart of DM ROI tracking. Start with the funnel metrics first, then connect them to revenue.
Reply rate shows whether your DMs are getting a response. The formula is simple: Reply Rate (%) = (Unique conversations with at least one reply ÷ Total DMs sent) × 100.
Track unique conversations, not total messages. Count only one reply per conversation thread. Also, keep outbound and inbound separate.
For outbound outreach, divide the number of prospects who replied by the number of DMs sent to new contacts. For inbound, divide the number of inbound DMs your team responded to by the total inbound DMs received. Use fixed weekly or monthly time periods so your comparisons stay clean.
Most small teams can start with a basic Google Sheets or Excel table with these columns:
When this baseline is clean, revenue attribution gets a lot easier.
Before you tag any conversation, define what counts as a lead and what counts as a sale. If you skip this step, two people on the same team can look at the same thread and label it in two different ways. That’s where messy reporting starts.
A lead is a conversation that shows purchase intent through action, like an email share, quote request, call booking, or invoice request. A compliment or emoji doesn’t count. A sale is a completed transaction tied to that DM.
Once those rules are set, use these formulas:
Add a Lead? (Y/N) column and a Sale? (Y/N) column to your tracking sheet. Tag each conversation once. That keeps the math clean and makes it easier to break results down by campaign or date range.
After reply rate, move into lead and sale conversion, then bring those tagged conversations into your order value numbers.
DM AOV ($) = Revenue traced to DMs ÷ Number of DM-attributed orders. This matters because DM buyers often choose different bundles or service tiers than buyers from other channels. Tracking DM AOV on its own shows what those conversations are producing. For example, if a coaching business closes 12 clients from Instagram DMs in July for a combined $3,600.00, the DM AOV is $300.00 per order.
Revenue per DM ($) = Revenue traced to DMs ÷ Total DM conversations. This shows revenue efficiency. If a U.S. agency has 150 DM conversations in a month and closes $7,500.00 in revenue, it’s generating $50.00 per conversation.
Next, connect these numbers to closed sales using tagged links, promo codes, and CRM fields.
Once reply rate, lead rate, and sale rate are set, the next job is simple: connect DM conversations to revenue. That means figuring out which chats led to clicks, purchases, and closed deals.
Use three signals for this:
Each one fills a different gap, and together they give you a much clearer view of what your Instagram DMs are bringing in.
Every link you send in a DM should include UTM parameters so your analytics platform can tell where that visit came from. A clean setup looks like this: utm_source=instagram, utm_medium=dm, and a readable utm_campaign name like spring_launch_dm_outreach or july4_dm_flash_sale.
You can also add utm_content if you want to separate message versions, such as script_a vs. script_b. That’s handy for A/B testing DM copy.
In GA4, keeping source=instagram and medium=dm the same across every campaign makes reporting much easier. You can filter DM-driven sessions and revenue in just a few clicks. It also helps to document one naming rule, such as [channel]_[initiative]_[month], so everyone on the team builds links the same way.
A branded short link keeps the message clean while still preserving the UTM data.
Use tagged links first because they give you fast, click-based attribution. Then use promo codes and CRM fields to catch what links miss.
UTM links only track revenue when someone clicks and buys in that same session. But that’s not always how people behave. Someone might read your DM, leave, and come back later by typing your URL straight into their browser.
When that happens, the sale may show up as direct traffic and your DM won’t get credit.
That’s where DM-only promo codes help. Create codes that appear only in DM scripts, not on your website, email list, or social feed. Examples like DMVIP20, INSTA_DM_10OFF, or COACHINGDM2026 make it easy to trace purchases back to one DM campaign.
Use one code per campaign. That keeps comparison clean and cuts down on guesswork later.
Set a firm expiration window too, such as 07/31/2026 at 11:59 PM PT. That helps reduce cross-channel leakage and nudges people to act sooner. From there, pull weekly or monthly reports from your e-commerce platform by filtering orders tied to each DM code.
Add those numbers to your DM dashboard as a separate widget so they sit next to UTM revenue. That way, you’re not relying on click data alone.
If you sell higher-ticket offers or have a longer sales cycle, CRM fields help track the attribution that links and promo codes can’t catch.
At a minimum, standardize these fields for every DM-sourced contact:
| CRM Field | Example Value | Why It Matters |
|---|---|---|
| Source Channel | Instagram DM |
Separates DM leads from Instagram ads or feed traffic |
| Campaign Name | spring_launch_dm_2026 |
Aligns with your UTM campaign naming for consistent reporting |
| First Touch | Inbound product question |
Shows where the relationship started |
| Last Touch | Sent checkout link |
Reveals DM's role at the bottom of the funnel |
| DM Conversation ID | Thread ID |
Lets you audit specific conversations when needed |
| Lead Status | Qualified, Proposal Sent, Closed Won |
Tracks funnel progression for DM-sourced leads |
Use dropdowns for Campaign Name and Lead Status instead of free-text fields. Small spelling differences like SpringLaunch2026 vs. spring_launch_2026 can wreck your reports fast.
Here’s the simple way to think about it: UTMs track immediate clicks, promo codes track delayed purchases, and CRM fields track closed deals.
With those revenue sources tagged, the next step is building a dashboard that shows DM revenue and ROI in a clear way.
Once UTM links, promo codes, and CRM fields are tagging DM revenue, pull that data into one dashboard. That way, you can see DM revenue in one place instead of bouncing between three systems. When tagging is done right, the dashboard turns scattered numbers into a view your team can use fast.
Your dashboard should include seven core widgets.
Put DM revenue, revenue per DM, sale rate, and AOV in top KPI tiles. Then add a funnel for reply rate, lead rate, and sale rate using the reply, lead, sale, AOV, and revenue-per-DM metrics defined above. This makes drop-offs easy to spot.
After that, add:
Set Channel = Instagram DM as the default filter so other Instagram traffic doesn't sneak in. Then give teams interactive filters for date range and campaign name. That makes campaign-level revenue checks much easier.
Use USD for currency, format dates as MM/DD/YYYY, and show numbers with commas for thousands and periods for decimals.
With those widgets in place, the next job is showing ROI.
Revenue by itself doesn't tell you return. Add an ROI widget with this formula:
DM ROI (%) = (DM revenue − DM costs) ÷ DM costs × 100
Here's a simple example: if DM revenue in July is $25,000 and total DM costs are $5,000, your ROI is 400%. Track this every month.
One common problem: teams undercount costs. To avoid that, include team labor (hours logged on DM management × fully loaded hourly cost - for example, 40 hours at $35/hour = $1,400), contractor time, software fees prorated by DM usage, creative costs for DM-specific scripts or assets, and any automation expenses.
Keep all of those costs in a single ledger and feed that data into the ROI widget.
Once ROI is on the dashboard, compare weekly trend checks with monthly performance reviews.
Weekly and monthly views do different jobs. One helps you catch swings fast. The other helps you make budget and staffing calls without overreacting to short-term noise.
| Reporting View | Best Used For | Key Benefit | Main Limitation |
|---|---|---|---|
| Weekly | Script testing, flash sales, team performance | Catches drops fast - e.g., revenue per DM falling from $20 to $12 in one week | Too volatile for budget decisions; one slow holiday week can look like a trend |
| Monthly | Budget planning, executive reporting, strategic campaigns | Smooths out weekly noise and shows real growth patterns | Slower to surface problems that need immediate fixes |
Review the 7-day view each week. Use the monthly view for budget and staffing decisions.
Use this dashboard to see performance clearly, then layer in audience growth signals to explain why results changed.
Once DM revenue is visible, the next step is simple: figure out what moved the numbers. One big factor is follower quality. Better-fit followers tend to turn into better DM results, so it makes sense to connect audience growth with DM conversion data.
Follower quality has a direct effect on DM conversion. UpGrow uses AI targeting, profile optimization, and audience filters to bring in followers who match your ideal customer profile.
To see whether that’s working, tag followers from a given campaign in your CRM. For example, use a label like "UpGrow-July-2026". Then compare that group’s DM performance against your baseline. Look at metrics like:
If that cohort beats your baseline, your targeting is bringing in people who are more likely to convert through DMs. It also helps to track each cohort by source, date, and targeting profile. From there, compare those groups with UpGrow growth timelines so you can spot which campaigns led to stronger DM outcomes.
Put UpGrow growth data next to your DM dashboard and look for patterns. A simple way to do this is to overlay UpGrow’s new-followers-per-day graph with your DM reply rate and revenue metrics for the same date range. Then mark the dates when you turned on the Boost™ tool or changed your targeting.
When a growth spike lines up with better DM results, that’s a signal worth paying attention to. In plain English: something in that targeting setup worked. Run that pattern again, watch the numbers, and use what you learn to shape your next growth cycle.
Once your dashboard is live, turn the whole thing into a simple weekly habit. Track Instagram DM ROI by watching funnel performance, tying revenue back to the right source, and reviewing everything in one dashboard. Before a campaign begins, set your definitions and stick to them. Reply rate, lead rate, sale rate, and average order value (AOV) should mean the exact same thing to everyone on your team, every single week. Use the formula as a quick gut check. If the dashboard shows something different, audit your inputs or your attribution setup.
Attribution is where teams most often get tripped up. Use UTM links for click-through sales and DM-only promo codes for purchases that happen later. So if one campaign brings in $25,000 from tagged DM clicks and another $7,500 from DM-only promo codes, your actual DM revenue is $32,500 - not $25,000.
Once the funnel math is clean, connect each conversation to revenue. This is where clean CRM fields matter. Standardize your CRM source fields so every DM lead uses the same source, channel, and campaign values. No free-text versions. No shorthand. No messy variations. When those fields stay consistent, you can filter your pipeline by DM source in seconds instead of spending hours fixing data.
With attribution and CRM fields set up, reporting becomes a simple weekly and monthly review. Weekly reports help you spot problems fast. Monthly reports help with budget calls. If revenue per DM drops week over week and volume hasn't changed, something likely slipped: a script, an offer, or a targeting change. Monthly views smooth out that week-to-week wobble and make the bigger pattern easier to see.
If you use UpGrow, its audience analytics can show which follower segments and content patterns are driving stronger DM conversations. That gives you a clearer view of what traffic to send into your DM funnel, without changing your UTM tags, promo codes, or CRM discipline. Put your naming rules, metric definitions, and reporting process into one shared playbook.
Connect your Instagram activity to your CRM or analytics platform. First, make sure your account is set up as a Business or Creator profile so tracking is turned on.
Then use unique UTM parameters in links you share in DMs. Once Instagram is connected to your CRM or Google Analytics 4, you can connect conversations to purchases and see how much revenue your DM work brings in.
Include all direct and indirect costs so you don’t overstate ROI by 30% to 50%.
That includes creator fees or commissions, platform or agency fees, product gifting, and shipping.
It also includes internal costs that are easy to miss, like staff time spent on content review and performance tracking, plus production costs for custom landing pages or graphics.
If you leave these expenses out, your ROI picture isn’t complete.
Review Instagram DM return on investment through both real-time monitoring and regular check-ins. For active campaigns and high-priority content, watch performance as it happens so you can make fast changes when something is off or a message starts working better than expected.
It also helps to set a steady review rhythm. Do a weekly check of your main metrics, then run a deeper monthly audit of automated message scripts and chat transcripts to keep quality and accuracy on track.