
How to Connect Instagram Data to Google Sheets
Add Instagram Insights to Google Sheets via connectors, automations, or CSVs; includes setup, formulas, alerts, and reporting best practices.
Add Instagram Insights to Google Sheets via connectors, automations, or CSVs; includes setup, formulas, alerts, and reporting best practices.
4.98 /5 - from 58k reviews
Trusted by 50,000+ creators — get real engagement delivered to your profile in minutes, not days.

You can move Instagram data into Google Sheets in three main ways: a Sheets connector, an automation tool, or a CSV export. If you want auto-updating reports, use a connector. If you want a row added when a new post goes live, use automation. If you only need a one-time report, export a CSV.
I’d first check three things:
From there, I’d keep the setup simple:
The article also shows how I’d track core metrics like reach, impressions, likes, comments, saves, shares, profile visits, and follower change, plus post, Story, and Reel data. It wraps up with sheet formulas, alert rules, sharing controls, and a way to keep month-over-month and week-over-week reporting in one workbook.
A few details matter more than they seem. Instagram exports are often limited to about 90 days per file, and a time-zone mismatch can push data onto the wrong date. So if I want clean reporting, I’d lock down raw tabs, use append-based sync, and keep naming the same across every sheet.
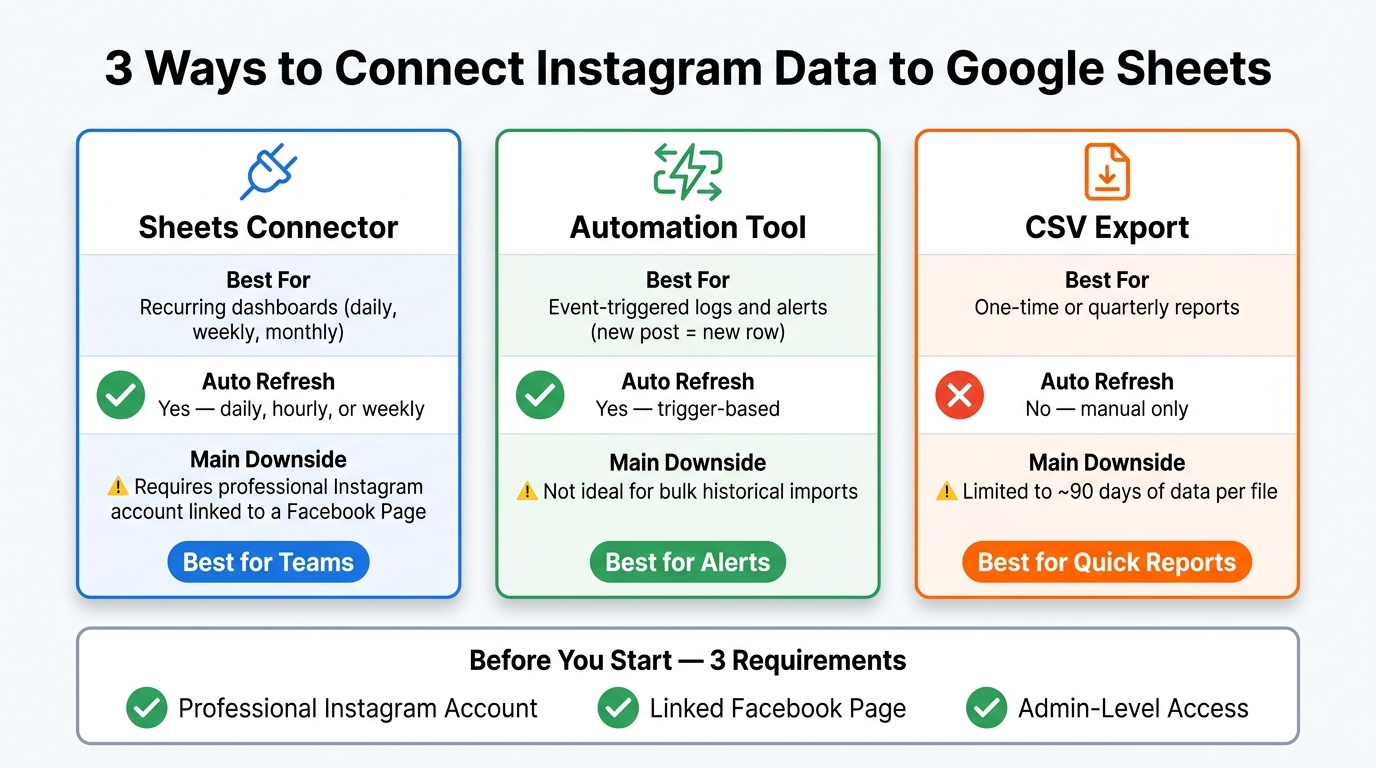
3 Ways to Connect Instagram Data to Google Sheets
| Method | Best use | Auto refresh | Main downside |
|---|---|---|---|
| Sheets connector | Recurring dashboards | Yes | Needs a Instagram for business account linked to a Facebook Page |
| Automation tool | New-post logs and alerts | Yes | Better for trigger-based rows than large past imports |
| CSV export | One-time reports | No | Usually limited to about 90 days per file |
Bottom line: if you want Instagram reporting that stays current in Google Sheets, set up the right access first, choose the sync method based on how often you report, and separate raw data, cleaned data, and dashboards from day one.
Before you connect Instagram to Google Sheets, make sure two things are in place: a professional Instagram account and a linked Facebook Page. Personal accounts can’t share Insights data through the Instagram Graph API.
Start there. Then pick the sync method that fits how often you check performance.
First, confirm your Instagram account type.
Open the Instagram app and go to Settings and privacy → Business tools and controls. If you see Switch to professional account, you’ll need to make that change first.
After that, check that your Instagram account is linked to a Facebook Page. You can do this in the Instagram app under Account → Linked accounts, or in Meta Business Suite under Settings → Business assets. That Page link is required to get analytics access.
Then verify that the Facebook user setting up the connection has admin-level access on the linked Page. If the role is lower, you may run into login issues or end up with missing data. You can check this in Meta Business Settings → Users → People.
Not every setup works the same way. Some are better for recurring dashboards. Others are better for one-off exports or alert-based workflows.
| Method | Best For | Strengths | Limitations |
|---|---|---|---|
| Sheets connector | Daily, weekly, or monthly dashboards | Scheduled refreshes, more metrics, automatic chart updates | Requires a Business or Creator account linked to a Facebook Page |
| Automation tool | Event-triggered logs and alerts | Adds a new row when new media is posted, can trigger email or Slack alerts | Better for event-driven records than bulk historical imports |
| CSV export | One-time, monthly, or quarterly reports | Quick manual export with no setup required | No automatic refresh; Insights exports are typically limited to about 90 days per file |
Here’s the simple way to think about it:
For example, if your team checks performance every weekday morning, a Sheets connector with a scheduled refresh usually makes the most sense. Once you’ve picked your method, the next step is to connect the source and map the essential Instagram metrics.
If you picked a Sheets connector in the last step, this is where the work starts.
Create a blank Google Sheet and give it a clear name, like Instagram Reporting – August 2026. Then go to Extensions → Add-ons → Get add-ons, search for an Instagram or Facebook Insights connector, install it, and approve access.
Next, open the connector setup panel. Choose Instagram or Meta for Instagram Insights as the data source, then sign in with the admin Facebook account linked to the right Facebook Page and Instagram account. That part matters more than people think. If you use the wrong account, your import can fail or pull data from the wrong place.
After that, pick the report type that fits what you want to track:
Create a tab called Raw_Data, set the connector to send data there, and run the import. If that tab fills up with rows of metrics, you’re good to go.
Use the field names your connector gives you, and keep labels the same across reports. That small habit makes dashboards easier to read and alerts less messy.
| Field Type | Recommended Fields |
|---|---|
| Time | Date (MM/DD/YYYY, e.g., 08/28/2026), Time Zone |
| Post Identifiers | Post ID, Content Type (feed, Reel, Story, Carousel), Caption Snippet |
| Exposure | Reach (unique accounts), Impressions or Views |
| Engagement | Likes, Comments, Saves, Shares, Profile Visits |
| Growth | Follower Count, Net Follower Change |
Set the date range in U.S. format, like Start: 08/01/2026, End: 08/28/2026. Use one reporting time zone for every import, such as America/New_York. Then match that setting in Google Sheets under File → Settings → General → Time zone.
If the time zone in your connector and your sheet don’t match, numbers can land on the wrong day. It sounds minor, but it can throw off reporting fast.
Scheduled refresh is what keeps reporting live instead of stale.
Use:
Send each refresh into Raw_Data first. Then recalculate Clean_Data and Dashboard, and after that, trigger alerts.
At this stage, keep raw imports separate from cleaned formulas. It’s a simple setup, but it saves a lot of headaches once the sheet starts updating on its own.
Once your import is automated, the next job is keeping the workbook clean. If you mix imports, formulas, and charts in the same place, refreshes can wreck your setup fast. A better move is to split each part of your social media workflow for Instagram so updates stay steady and the sheet stays easy to scan.
Set up the workbook in three layers:
Account_Insights_Raw, Posts_Raw, Stories_Raw, Reels_Raw) - keep untouched imports here exactly as the connector sends them. Don’t add edits or formulas in these tabs.Metrics_Clean) - use this tab for calculated fields like engagement rate, week number, and content group. This is where SUMIF and COUNTIFS belong.Overview_Dashboard, Content_Performance) - pull data from Metrics_Clean only. Don’t reference raw tabs in dashboards.Posts_Raw is your main data tab for post-level metrics. The other tabs should flow from it.
After you split the tabs, standardize dates and IDs. That small step saves a lot of headaches when formulas start stacking up.
Use the same formatting rules across the workbook:
| Column Type | Format | Example |
|---|---|---|
| Date | mm/dd/yyyy |
08/28/2026 |
| Timestamp | mm/dd/yyyy hh:mm AM/PM |
08/28/2026 03:15 PM |
| Numbers | 1,234.56 |
12,450.00 |
| Currency | $1,234.56 |
$875.50 |
Set the locale to the United States so Google Sheets reads dates and numbers the right way. Also keep date, post_id, post_url, content_type, and campaign_tag exactly the same across tabs. If those fields drift even a little, lookups and filters can go sideways.
Each dashboard should include three parts: a KPI strip at the top for current totals and changes, trend charts in the middle, and a top-content table at the bottom that ranks your best posts or Reels. The right setup depends on how often you review performance.
Here’s the difference between daily, weekly, and monthly views:
| Dashboard Frequency | Data Granularity | Sheet Size | Maintenance |
|---|---|---|---|
| Daily | Row per day or post; fine detail for 7–30 day windows | Grows quickly over many months | Higher; best for active campaign monitoring |
| Weekly | Aggregated by week; balances detail and overview | Moderate; fewer rows than daily | Medium; good for regular client or team reviews |
| Monthly | Aggregated by month; high-level summary | Lowest; stays compact over years | Lower; ideal for executive reporting |
Use one master workbook, then filter by date range or reporting period. Raw data keeps building in the background, while each dashboard tab shows the exact view you need from the same clean source.
With the workbook in place, you’re ready to add formulas, alerts, and scheduled actions.
Use formulas, alerts, and sharing rules to keep reports current without a lot of manual checking.
Lean on SUMIFS, AVERAGEIFS, COUNTIFS, IF/IFS, ARRAYFORMULA, TEXT, DATE, and SPARKLINE to track KPIs, trends, and rollups.
For engagement rate per post, divide total engagements by reach. If your Metrics_Clean tab stores Likes in column H, Comments in I, Shares in J, Saves in K, and Reach in G, use:
=((H2+I2+J2+K2)/G2)
Format the result as a percentage.
For daily follower change, subtract start followers from end followers. To run this across the whole column, use ARRAYFORMULA:
=ARRAYFORMULA(IF(ROW(E:E)=1,"Daily_Followers_Change",IF(E:E="","",F:F-E:E)))
For average reach per post across a date range, use AVERAGEIFS with your dashboard's start and end date cells:
=AVERAGEIFS(Metrics_Clean!G:G,Metrics_Clean!A:A,">="&Start_Date,Metrics_Clean!A:A,"<="&End_Date)
If you're building recurring reports, roll post-level data up by week or month. Add a Week_Start helper column on Metrics_Clean with:
=A2-WEEKDAY(A2,2)+1
Then pull weekly totals on your dashboard with SUMIFS, filtered by week and content type:
=SUMIFS(Metrics_Clean!H:H,Metrics_Clean!L:L,$A2,Metrics_Clean!C:C,$B2)+SUMIFS(Metrics_Clean!I:I,Metrics_Clean!L:L,$A2,Metrics_Clean!C:C,$B2)+SUMIFS(Metrics_Clean!J:J,Metrics_Clean!L:L,$A2,Metrics_Clean!C:C,$B2)+SUMIFS(Metrics_Clean!K:K,Metrics_Clean!L:L,$A2,Metrics_Clean!C:C,$B2)
Use SPARKLINE in a dashboard cell when you want a quick visual of rolling engagement trends.
For cleaner number formatting, use TEXT(value,"#,##0") so U.S. thousand separators stay consistent across the workbook.
Once the KPIs are in place, set thresholds so dips stand out right away.
Create a dedicated Alerts_Config tab with columns for Metric_Name, Description, Threshold_Type (Min or Max), Threshold_Value, and Active (TRUE/FALSE). A simple setup might look like this:
| Metric | Threshold Type | Threshold Value | Active |
|---|---|---|---|
| Min_Daily_Reach | Min | 5,000 | TRUE |
| Max_Follower_Drop | Max | -100 | TRUE |
| Target_Engagement_Rate | Min | 0.03 | TRUE |
On your dashboard, point status formulas to those values. If yesterday's reach is in B3, use:
=IF(AND(Alerts_Config!E2,B3<Alerts_Config!D2),"ALERT: Daily reach below target","OK")
For follower drops, if daily follower change is in B4, use:
=IF(AND(Alerts_Config!E3,B4<Alerts_Config!D3),"ALERT: Follower drop exceeded","OK")
Use conditional formatting for visual warnings. For example, any post with an engagement rate below your target can turn red automatically. That makes weak spots easy to catch during a fast review.
If you want notifications beyond the sheet itself, each channel has a different job:
| Alert Channel | Speed | Visibility | Setup Effort |
|---|---|---|---|
| In-Sheet conditional formatting | Low to Medium | Medium - visible only when the sheet is open | Low |
| Email (via Sheets or Apps Script) | Medium | Medium - good for individuals, can get buried in inboxes | Low to Medium |
| Slack (via Apps Script or automation tool) | High - near real-time | High - shared channels, easy to pin | Medium |
A practical setup is to use all three: in-sheet indicators for analysts, email for daily summaries, and Slack for time-sensitive drops like a sudden reach crash or follower loss.
After alerts are working, tighten access so the report stays clean.
Give clients Viewer access and teammates Commenter access on dashboards. Protect raw and clean data tabs with Protected sheets and ranges so only analysts can change source data or Alerts_Config. You can also use Filter views on dashboard tabs so each person can sort by campaign or date range without changing the default view for everyone else.
Use UpGrow's live dashboard alongside Sheets to decide which fields belong in your reporting setup. Mirror the hashtags, themes, and campaign tags that drive the strongest Reels performance.
An Instagram-to-Sheets workflow turns analytics into a live reporting system.
Once your sheet structure is set up, the main job is keeping the data right over time. Use append-based sync so you keep past records for week-over-week and month-over-month comparisons. Add protected raw tabs and role-based sharing, and the report stays clean even when multiple people use it.
If your team uses UpGrow, you can use the same dashboard to view growth data next to native Instagram metrics. That lets you track UpGrow performance data alongside Instagram metrics and connect follower growth, engagement, and reach in one place.
That setup keeps reporting accurate, automatic, and easy to review.
Your Instagram account might not connect to Google Sheets if it isn’t set to Professional mode, which means Business or Creator. Those are the only account types that can use the Insights and data permissions needed for API syncing.
If you're using an API integration, the connection can also break when the Meta developer setup isn’t fully configured. The same goes for access tokens that don’t include the right permissions, such as instagram_business_manage_insights, instagram_manage_insights, or instagram_basic.
Choose the option that fits your team’s setup and how much data you need to handle:
If you want live reporting without doing the work by hand, UpGrow can track metrics for you automatically in a dashboard.
Convert all UTC API timestamps to your U.S. local time zone, then format each date as MM/DD/YYYY. Use the same 12-hour AM/PM time format everywhere, and stick to one time zone across the entire sheet.
Also, leave out the most recent 48 hours to avoid reporting-delay issues. Treat empty data sets differently from zero values, and lock header formulas so they don’t get changed by accident.


