AI Competitor Follower Analysis for Instagram
Use AI to spot repeated follower and content patterns across competitors to guide targeting, content, and monthly tests.
Use AI to spot repeated follower and content patterns across competitors to guide targeting, content, and monthly tests.
4.98 /5 - from 58k reviews
Trusted by 50,000+ creators — get real engagement delivered to your profile in minutes, not days.
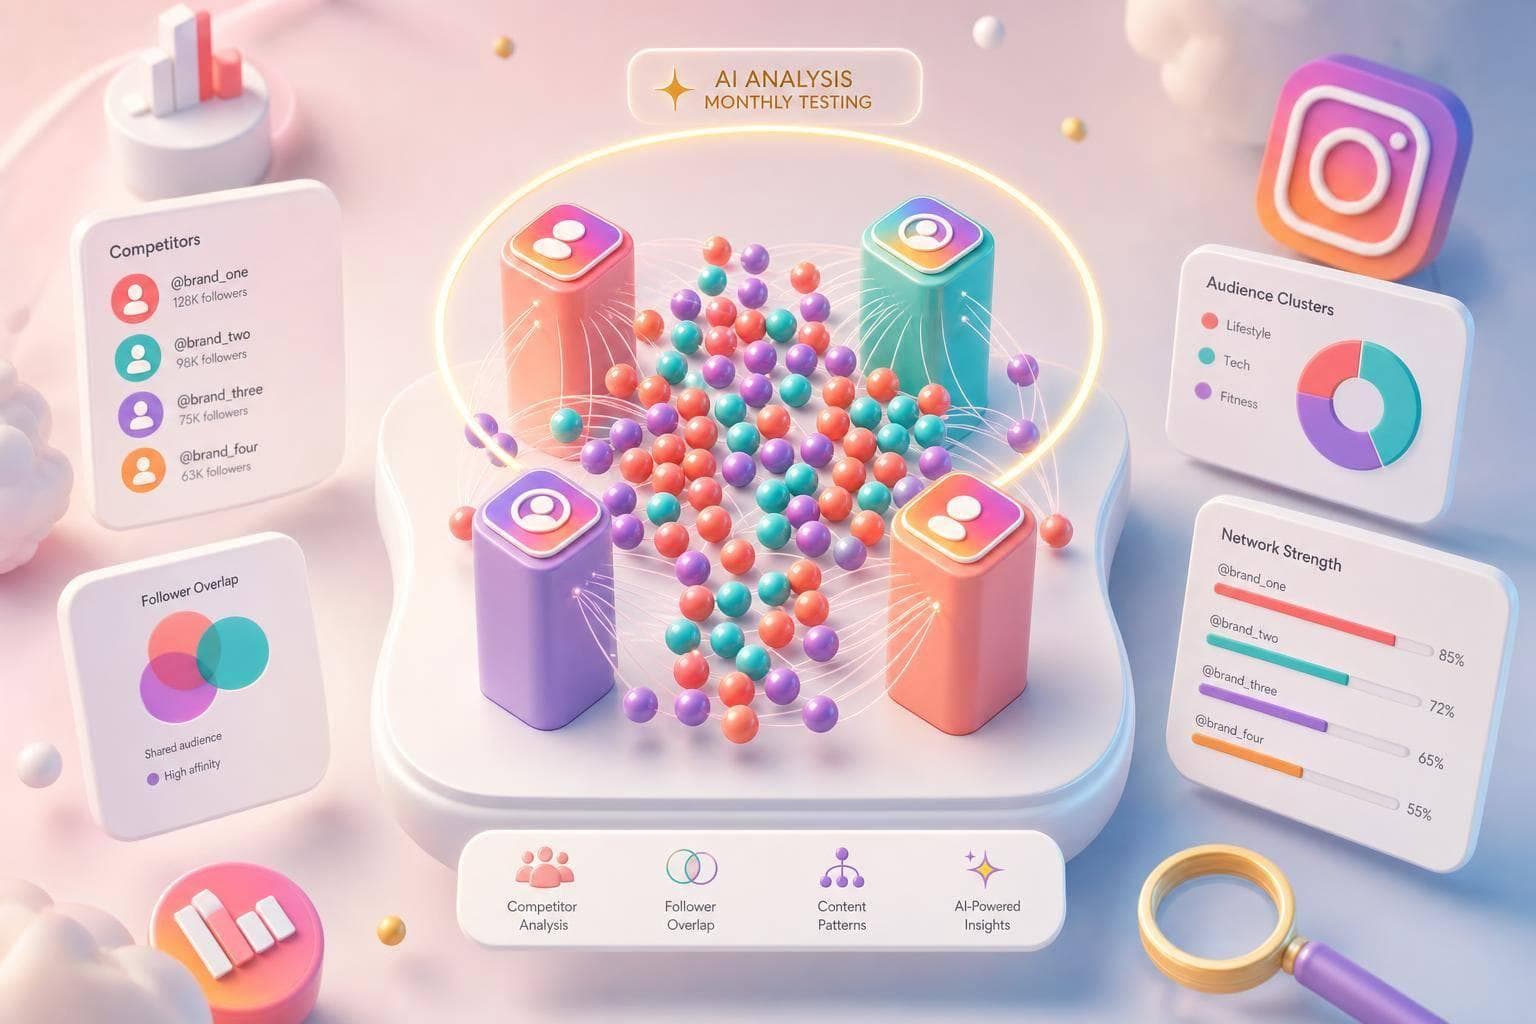
If I want more Instagram followers, I don’t need more guesses. I need pattern data from accounts that already pull the audience I want.
Here’s the short version: I use AI competitor follower analysis to see which accounts grow, what content gets saves, shares, and comments, when people engage, and which audience signals show up again and again. Then I turn that into a simple plan for content, targeting, and monthly testing.
A few points stand out fast:
Here’s a simple example. If a post gets 250 likes, 20 comments, 15 saves, and 10 shares on an account with 2,500 followers, the engagement rate is 11.8%. That’s well above the common Instagram range of about 3.0%–3.7%. That kind of result tells me the content format is worth a close look.
I also keep the workflow simple:
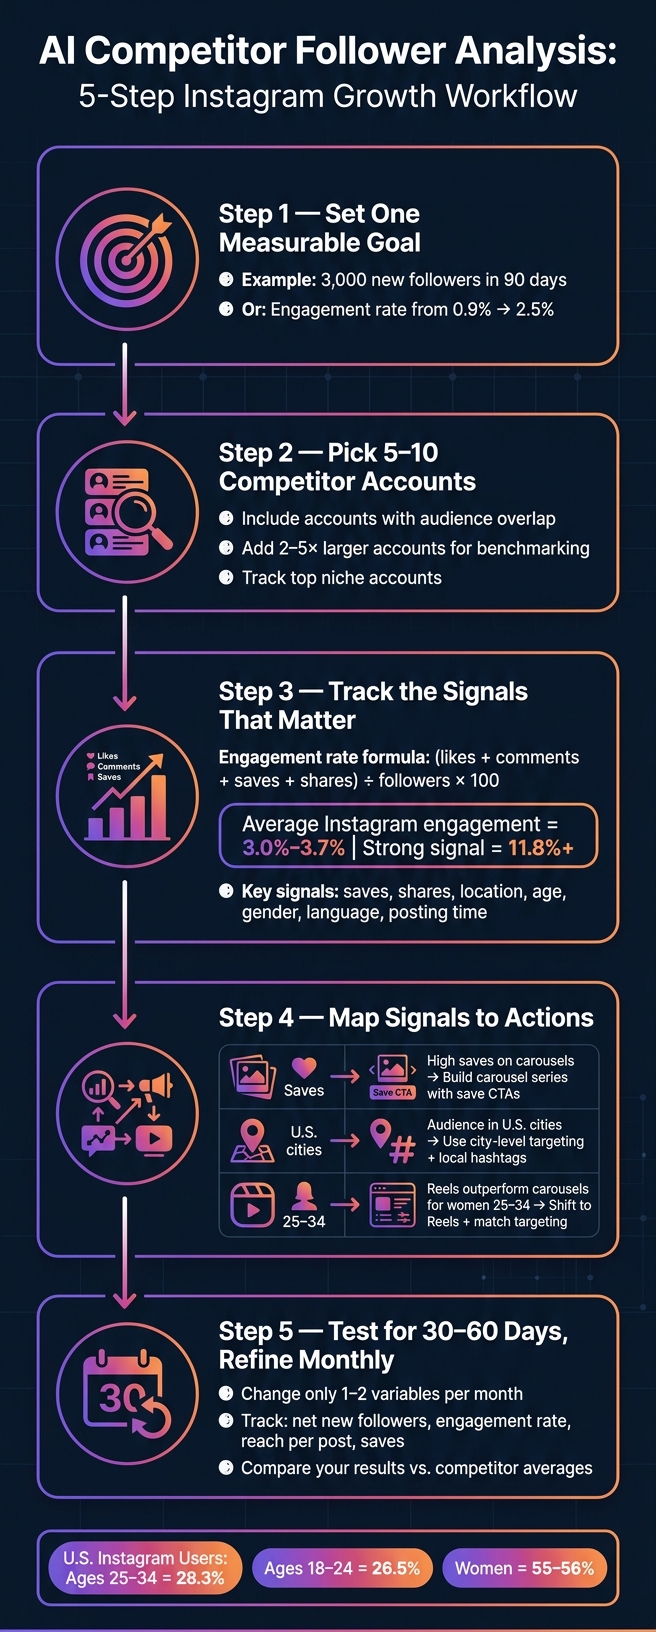
AI Competitor Follower Analysis: 5-Step Instagram Growth Workflow
| Source | What I use it for | Main limit |
|---|---|---|
| Instagram Insights | Check my own account performance | No competitor view |
| Competitive Insights | Compare up to 10 public professional accounts | Short lookback and lighter detail |
| External analytics tools | Track post history, themes, timing, and engagement over time | Based on public data and tool coverage |
| UpGrow | Apply targeting filters and monitor growth activity | More for execution than research |
The main idea is simple: I look for repeated audience and content patterns, not one-off spikes, then use those patterns to guide what I post, who I target, and how I measure progress.
Once AI shows you follower patterns, the next step is simple: focus on the signals that point to audience fit. You want better filters, tighter targeting, and faster growth, not a giant spreadsheet full of numbers you’ll never use.
Follower count gets the most attention. But by itself, it doesn’t tell you much. A smaller account with steady growth and strong saves, shares, and comments is often the better benchmark.
The metric that connects account size with audience quality is engagement rate:
(likes + comments + saves + shares) ÷ followers × 100
Here’s a simple example. If a post gets 250 likes, 20 comments, 15 saves, and 10 shares from an account with 2,500 followers, the engagement rate comes out to 11.8%. For context, average Instagram engagement across industries sits at about 3.0%–3.7%.
Saves show staying power. Shares show people want to pass the post on. That’s where things get useful. If a competitor’s educational Reels keep pulling in saves, that usually means the audience wants practical, teachable content. In plain English: that format deserves more attention in your own plan.
After you judge quality, the next question is: who are these followers? The most useful demographic signals are location, age, gender, language, and activity windows.
Location is especially useful for U.S.-based creators, small businesses, and agencies. If a competitor’s audience is heavily concentrated in the United States, that’s a strong sign to lean into English-language content, U.S. references, and posting windows that match Eastern and Pacific time zones. For local businesses, city-level patterns matter even more. If followers cluster around a few cities, that can support local hashtags and region-specific creative.
Age and gender help shape tone and format. As of 2024, the biggest U.S. Instagram age group is 25–34, making up 28.3% of users. Next is 18–24 at 26.5%. Women account for about 55–56% of U.S. Instagram users. So if a competitor’s strongest engagement comes from women ages 18–24, that should feed straight into both content decisions and audience filter settings.
The point is to tie each signal to a clear move, whether that’s a content choice, a posting-time change, or a tighter audience filter. Otherwise, you’re just collecting data and calling it strategy.
| Signal | Observation | Action |
|---|---|---|
| High engagement on educational Reels | Ages 18–24 save and share frequently | Increase short-form educational content; narrow age filters to 18–24 |
| High U.S. follower concentration | Majority active in U.S. time zones | Use English-first captions and U.S.-aligned posting windows |
| High save rate on carousels | Audience values "how-to" and reference content | Shift content mix toward infographic and tip-based carousels |
| Low engagement despite large following | Potentially unreliable benchmark | Avoid using this competitor as a benchmark |
| Strong city-level concentration | Audience clusters in specific U.S. metros | Test localized hashtags and city-specific creative |
Once you know which follower signals matter, the next step is simple: use tools that let you compare those signals across accounts and over time.
A good place to start is Instagram's own Professional Dashboard. Its Competitive Insights feature lets business and creator accounts track up to 10 public professional accounts and compare performance across 30-, 60-, or 90-day windows. That gives you a clean snapshot of follower growth, posting frequency, and Reels output.
That alone can answer a few core questions:
Still, native Instagram data has a pretty clear ceiling. It shows short-term, top-level metrics, but it doesn't keep a long archive of data. It also doesn't break engagement down by content theme or show posting rhythm across longer stretches.
That's where external analytics dashboards come in. These tools collect public post metadata like timestamps, formats, hashtags, and visible engagement counts, then store that data over time. When you look at months of posts instead of a 90-day slice, patterns start to stand out. You can see when a competitor shifted formats, posted more often, or leaned into a topic that got a stronger response.
This is where AI starts doing the heavy lifting.
AI can sort posts by both format and theme - tutorials, product demos, local service content, behind-the-scenes - by using computer vision and natural language processing on images, video, and captions. From there, it matches those themes against engagement results across many posts and many accounts.
That matters because one viral post doesn't tell you much on its own. A repeated pattern does. If tutorial-style Reels keep pulling strong engagement across similar accounts, that's a signal. If behind-the-scenes content gets views but weak interaction, that's a different signal. Over time, you start to see what the audience responds to on a steady basis, not just what spiked once.
AI can also spot signs of inflated or inactive follower patterns. That helps you avoid bad benchmarks. A competitor may look strong at first glance, but if the audience isn't active, copying that account's content mix can send you in the wrong direction. That's the point where follower data stops being just observation and starts shaping targeting choices.
Once the analysis is done, UpGrow is the part that puts those signals to work. It acts as the execution layer in this workflow - the step where audience patterns turn into actual targeting decisions.
In practice, that means UpGrow takes what you learned from competitor and audience analysis and applies it through targeting filters, live monitoring, and profile optimization.
Here's how the four main data sources compare across the workflow:
| Tool | What it covers | Key limits | Best use |
|---|---|---|---|
| Instagram Insights | Own-account reach, impressions, follower demographics, content performance | No competitor data | Baseline your own account |
| Competitive Insights | Up to 10 public professional accounts over 30–90 days | Limited metrics; no deep audience segmentation | Quick native benchmarking |
| External analytics dashboards | Historical trends, posting rhythm, format mix, post-level engagement | Depends on tool and public data availability | Deeper competitive analysis at scale |
| UpGrow | AI targeting filters, live analytics, Boost™, profile optimization | Growth-focused, not a research tool | Turn insights into follower acquisition |
Once you can see the signals, the next step is simple: turn them into a monthly plan you can actually use.
Start with one measurable goal. For example, you might want to add 3,000 followers in 90 days or move your engagement rate from 0.9% to 2.5%.
That goal tells you which competitors matter.
If you want more local reach, track accounts whose followers are concentrated in your target city. If you want a niche audience, focus on accounts whose followers lean toward that interest group, not just your broader industry.
Then build a shortlist of 5–10 accounts. A good mix usually includes:
That mix gives you benchmarks that feel realistic and shows you what stronger growth looks like.
From there, the job is to turn those patterns into clear targeting rules and content rules.
Look for patterns that show up across multiple competitors, not just one post that happened to take off.
Then move straight into action. Build both your targeting setup and your content calendar from the same set of signals. When those two stay in sync, your plan is much easier to run.
If Reels keep beating carousels among women ages 25–34, shift more of your output toward Reels and match your targeting to that group. UpGrow's smart AI-targeting lets you use filters like age, gender, city-level location, interests, and language, which means competitor signals can become direct targeting inputs.
Use those same patterns in your content plan too. If educational carousels keep earning more saves, make more of them. If niche hashtags appear again and again in high-performing posts, work them into your captions and topic clusters.
| Competitor Pattern | Growth Plan Action | Content Change | Targeting Setting | Key KPI |
|---|---|---|---|---|
| High engagement on Reels vs. carousels | Shift production priority to short-form video | Increase Reels frequency | Format split | Reach / Views |
| Audience concentrated in specific U.S. cities | Launch localized campaign | Reference local culture and events | City-level location filters | Local follower growth |
| Strong saves on educational carousels | Build a carousel series around core topics | Add clear save/share CTAs to each slide | Interest and age filters | Saves per post |
| Fast growth, weak engagement | Exclude from benchmark set | Audit for bot or fake follower patterns | Audience authenticity checks | Engagement rate |
| Consistent response to niche hashtags | Incorporate those tags into your own posts | Align captions with proven hashtag clusters | Hashtag / interest filters | Engagement rate |
Check results once a month and log the same numbers every time: net new followers, engagement rate, reach per post, and saves. Then pull the same date range for your tracked competitors and compare side by side.
If your follower growth is beating competitor averages, your current mix is doing its job. If engagement is behind, look again at your themes, hooks, and posting times to see whether they match what the audience responds to.
UpGrow's real-time dashboard and 24/7 monitoring make this easier because you can keep an eye on the numbers all month. That way, your monthly review is more like reading the scoreboard than digging through data at the last minute.
Keep changes small. Adjust one or two variables per month, then watch the effect over the next 30 days. Review the same metrics each month, change one thing at a time, and track what happens.
Once you have the data, the next step is simple: turn it into repeatable targeting decisions.
AI competitor follower analysis helps you see which competitors pull in your ideal audience and which content patterns lead to engagement. That gives you something more useful than guesswork. It gives you patterns you can test.
Track essential Instagram metrics like:
Stick with 3–5 competitors, compare the same metrics each month, and test repeated patterns for 30–60 days.
When certain themes, formats, or audience signals keep showing up, fold them into your growth workflow. UpGrow helps put those insights to use with AI targeting, live analytics, and organic growth tools.
Monitor monthly, act on what repeats, and refine what drives follower growth, profile visits, and conversions.
AI uses machine learning to study Instagram behavior and demographic data, like likes, comments, Story views, and video completion rates. From there, it builds audience profiles and groups people who share similar interests.
It also tracks activity in real time to spot what content gets the best response and when people are most active. UpGrow then uses those insights with filters such as location, age, gender, and language to zero in on high-intent users.
Look past follower count and pay attention to the numbers that show actual interest and audience fit: engagement rate, saves, shares, reach, and impressions.
It also helps to track profile visits, follows from posts, watch time, and follower growth rate. When you review those metrics by age, gender, and location, you can see whether you're bringing in the right people, not just more people. UpGrow’s real-time dashboard can help you monitor these signals over time.
Start by looking for patterns in competitors’ best-performing posts. Pay attention to the topics, angles, and formats that show up again and again. Then use what you find to tighten your targeting so it lines up with the audience behind those results.
With UpGrow, you can filter by location, age, gender, and niche interests, then monitor results in real time. Think of your strategy as a steady testing cycle: check performance, tweak your content and posting times, and let the data guide better follower quality and growth.