How To Visualize Instagram Follower Growth Data
Learn which follower metrics to track, how to collect and clean data, and which charts and dashboards reveal meaningful Instagram growth insights.
Learn which follower metrics to track, how to collect and clean data, and which charts and dashboards reveal meaningful Instagram growth insights.
4.98 /5 - from 58k reviews
Trusted by 50,000+ creators — get real engagement delivered to your profile in minutes, not days.
Your Instagram follower count is more than a number - it reflects your reach and credibility. Visualizing follower growth data helps you understand trends, measure campaign success, and make informed decisions. This guide explains how to track key metrics, prepare data for analysis, and create visual dashboards for actionable insights.
By turning raw data into clear visuals, you can optimize strategies, identify patterns, and achieve consistent follower growth.
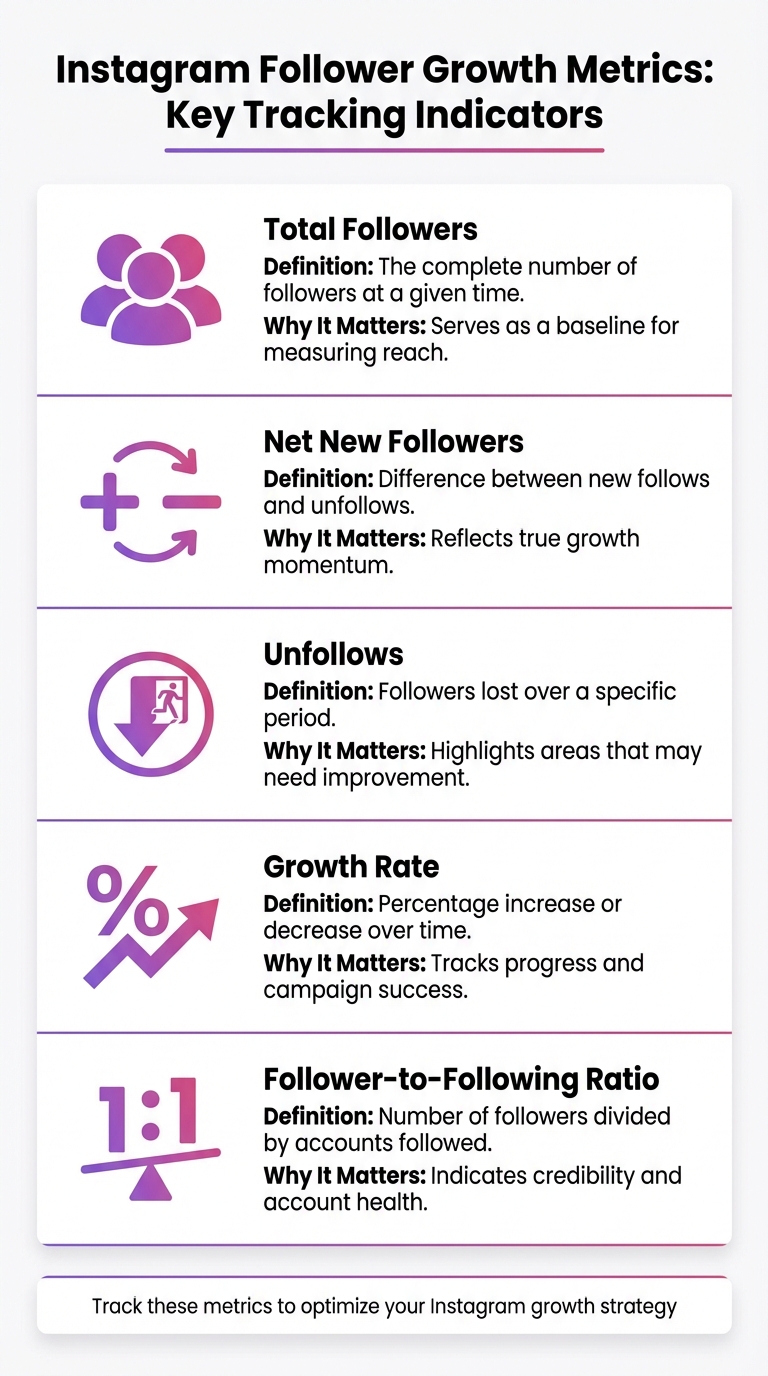
Instagram Follower Growth Metrics: Key Tracking Indicators
Understanding the numbers behind your Instagram growth is essential. While your total follower count gives an overview of your reach, the net new followers metric - calculated as new follows minus unfollows - provides a clearer picture of your actual growth. Keeping an eye on unfollows can help pinpoint strategies that might be slowing your momentum. Additionally, your follower-to-following ratio plays a role in your credibility; having more followers than accounts you follow suggests a strong, influential profile. Lastly, the growth rate - the percentage change in followers over time - offers insight into your performance and the effectiveness of your campaigns.
| Metric | Definition | Why It Matters |
|---|---|---|
| Total Followers | The complete number of followers at a given time | Serves as a baseline for measuring reach |
| Net New Followers | Difference between new follows and unfollows | Reflects true growth momentum |
| Unfollows | Followers lost over a specific period | Highlights areas that may need improvement |
| Growth Rate | Percentage increase or decrease over time | Tracks progress and campaign success |
| Follower-to-Following Ratio | Number of followers divided by accounts followed | Indicates credibility and account health |
Once you’ve identified these metrics, the next step is knowing where to find this data.
Switching to a Business or Creator profile unlocks Instagram Insights. This tool provides access to data from the past 7, 14, 30, or 90 days. However, keep in mind that Instagram only retains data for 90 days, so older metrics won’t be available.
For a deeper dive, the Meta Business Suite offers additional functionality, including desktop access and customizable timeframes. If you need historical data beyond Instagram’s 90-day window, third-party tools can fill the gap. For instance, platforms like UpGrow provide real-time tracking, alerts, and AI-driven trend analysis. They even offer free tools like a Real-Time Follower Count Tracker for quick insights into your growth.
Once you’ve gathered your data, proper formatting ensures accuracy in your analysis. Stick to the MM/DD/YYYY date format (e.g., 01/12/2026) and use commas to separate thousands (e.g., 10,500). When calculating growth rates, display percentages with two decimal places (e.g., 1.25%) to capture even minor fluctuations.
Most analytics tools and spreadsheet software default to U.S. formatting, so adhering to these conventions helps avoid errors during imports or when creating visualizations. When exporting data from Instagram Insights or third-party tools, choose formats like CSV or Excel that retain these standards.
Raw follower counts on their own don't tell the full story. To add context, create a daily snapshot table that includes these key columns: Date, Total Followers, Net Change (followers gained minus lost), and Growth Rate (percentage change from the previous day). Since Instagram's API only provides the current data snapshot and doesn't keep historical records, you'll need to pull and store this data daily to build a complete history.
Automating this process is essential. Use scheduling tools to set up daily data pulls, ensuring your historical database stays updated. If you're relying on API-based collection, remember that you'll need to re-authenticate approximately every two months to avoid any interruptions in your data collection.
Once you've automated the process, take the time to clean and standardize your dataset to ensure accuracy.
For reliable visualizations, your data needs to be spotless. Start by cleaning it: fill in any missing values (clearly marking them as estimates), remove duplicates, and use built-in functions in your tools to identify and separate campaign-driven spikes from normal fluctuations. Standardize your dates and calculate daily changes using transformation features in your chosen tool. To maintain consistency, align all data to a single time zone - U.S. Eastern Time is a common choice - so daily snapshots are comparable.
With a clean and organized dataset, you're ready to automate ongoing tracking and dive into visualization.
Manually collecting data can lead to errors and inconsistencies. Platforms like UpGrow simplify this process with their real-time analytics dashboard, which automates data tracking and provides hourly updates. This eliminates the need for manual entry while offering instant insights into growth trends and retention rates.
UpGrow also segments your follower data automatically using AI-powered filters, breaking it down by factors like location, age, gender, and language. Need to share your findings? The platform allows you to export data or create polished PDF reports, making it easy to transition from raw data to professional presentations.
With over 58,980 users and a stellar 4.98/5 rating based on more than 58,000 reviews, UpGrow has established itself as a trusted tool for automated data management. As one satisfied user from Dreamize SMA shared:
"It really works. I've tried other Instagram growth services in the past, but UpGrow is by far the best. They really deliver on their promise of real, organic growth."
The type of chart you pick can make all the difference in how easily you spot trends and take action. Line graphs are perfect for tracking long-term changes like total follower count over months or years. They help you identify momentum and pinpoint spikes tied to specific events - like launching a paid boost or collaborating with an influencer - by marking those events directly on the timeline. This makes it easier to connect the dots between your campaigns and their outcomes.
Bar charts shine when comparing data across distinct time periods. Want to see how many new followers you gained each week or month? A bar chart lays it out clearly, making seasonal trends jump out at you. For example, if you’re running a holiday campaign, bar charts can show how that period's growth compares to your usual baseline. They’re also handy for benchmarking - stack your monthly growth rate against industry standards to see if you’re keeping up with your competitors or falling behind.
If you’re looking to dig deeper, combination charts can take your analysis to the next level. By overlaying multiple metrics, you can uncover connections between them. For instance, plot your follower growth alongside posting frequency or content type to reveal what’s driving results. If you notice a follower spike during weeks when you posted three Reels instead of static images, you’ve just uncovered a winning content strategy. As Nidhi Parikh, a SaaS writer at Socialinsider, puts it:
"Follower growth only makes sense when you calculate it properly. Raw numbers don't tell you much but percentage growth and trends reveal a lot of insights."
For a more detailed breakdown, segmented views like stacked bar charts let you analyze growth by demographics - such as age groups and gender - helping you see if you’re reaching the right audience. Meanwhile, pie charts can show which content types, like Reels or Stories, are dominating your reach. If you're tracking progress toward a specific goal, gauge charts provide a quick snapshot, while data tables allow you to drill into granular metrics, making it easy to sort and filter post-level performance.
Take Kimberly Herrington, an SEO consultant, as an example. Between February and September 2019, she grew her Instagram following from 480 to 820 - a 70% increase over six months. By using Later Analytics, she tracked growth spikes and tied them directly to her manual engagement efforts. This approach helped her achieve a 21% monthly growth rate by visualizing what strategies were working in real time. Her story highlights how the right charts can turn raw numbers into actionable insights.
Once you’ve organized your data, the next step is to put it to work by creating a real-time dashboard that turns raw numbers into actionable insights.
A strong dashboard starts with scorecards that give you a quick snapshot of your current follower count. To track trends, include line graphs that show how your followers increase or decrease over time, helping you identify spikes from successful campaigns. Add an unfollow detection tool to alert you when changes to your content lead to follower loss. To make sure your targeting is effective, incorporate segmentation panels that break down your audience by demographics and interests, using the insights you’ve already gathered.
For a deeper dive into performance, add a data table that ranks posts by reach, saves, and engagement. Filters for content types - like Reels, Stories, or static posts - can help you zero in on what’s working. A gauge chart can track progress toward monthly follower goals, while a geo map visualizes where your audience is located, giving you a clearer picture of your reach.
While Instagram’s native Insights offer useful data, they’re limited to a 30-day window and lack customization options. To create a dynamic, live dashboard, you’ll need tools like Coupler.io to connect your Instagram Business account to platforms such as Looker Studio, Power BI, or Google Sheets. These tools use Instagram’s official API, so you won’t have to deal with manual exports or share sensitive account details.
Set up scheduled refreshes to keep your data current. You can choose intervals as frequent as every 15 minutes or as infrequent as once a month, depending on how closely you want to monitor changes. Clean up your data by removing unnecessary columns, calculating metrics like engagement rates, and merging multiple accounts. This ensures your dashboard remains accurate and focused.
Once your data is streamlined, you can integrate it into platforms like UpGrow, which offer a seamless, automated dashboard experience.
UpGrow takes automated data collection a step further with a live dashboard that updates 24/7. It tracks real-time follower counts and hourly growth, making it easy to spot momentum shifts. With over 50 metrics tracked, including unfollow alerts, you’ll know immediately if a strategy isn’t working.
Its Boost™ feature includes a dedicated tracking panel that measures the performance of AI-assisted growth. Beta users reported a 275% increase in monthly followers, and the dashboard allows you to monitor this impact in real time with adjustable speed settings like Slow, Moderate, or Turbo. On top of that, UpGrow provides weekly performance reports and downloadable PDFs covering engagement rates and content performance - perfect for sharing with clients or team members. With a 4.98/5 rating from over 58,000 reviews, users consistently praise its ability to drive organic growth while keeping insights clear and actionable.
Your dashboard can reveal three key growth trends: steady upward movement, flat plateaus, and sharp spikes. A consistent upward trend suggests your content is connecting well with your audience. On the other hand, flat plateaus might indicate repetitive content, poorly timed posts, or a loss of relevance. Sharp spikes, meanwhile, could point to short-lived follower gains, often linked to low-quality growth.
To make sense of these trends, tie growth spikes to specific actions. For instance, if you notice that Tuesday mornings consistently outperform Friday evenings in follower gains, it might be time to rethink your posting schedule. You can also run correlation analyses to see which content types - like Reels or Carousels - are driving the most new followers. With over 70% of Instagram users now spending their time watching Reels, prioritizing this format could lead to faster gains. By identifying these patterns, you can fine-tune your content strategy for sustained, meaningful growth.
Follower count is just one piece of the puzzle. To get a fuller picture, compare your growth trends with engagement metrics. For example, if your follower count is climbing but engagement rates are dropping, you might be attracting passive viewers rather than active participants. A particularly important metric for organic growth is "Sends per Reach", which measures how often users share your content through direct messages. In 2026, this is expected to be a top algorithm signal for boosting visibility.
Take a closer look at your audience demographics after each growth spike. If a viral Reel brings in 500 new followers but they fall outside your target age range or geographic location, that growth might not translate into stronger engagement or sales. As a benchmark, smaller accounts (0–1K followers) tend to grow by 10–30% monthly, while larger accounts (10K–100K followers) typically see growth rates of 2–5%. Falling below these averages could indicate that your content strategy needs a refresh. Comparing these metrics helps you understand your audience better and lays the groundwork for refining your approach.
Once you've analyzed your metrics, use the insights to adjust your strategy. Build a feedback loop where your data directly informs your next steps. For instance, if your growth has stalled, try increasing your posting frequency from three to four times a week and monitor whether your reach remains steady. When you notice a spike, dig into what caused it - whether it was a specific hashtag, a collaboration, or trending audio - and incorporate those elements into future posts.
Use these insights to benchmark yourself against competitors. If similar accounts are growing at 4% per month while you're stuck at 1%, it might be time to experiment with new content formats or refine your targeting approach. Tools like UpGrow's AI-assisted Boost feature have helped users see a 275% increase in monthly followers. By connecting your data-driven observations to actionable changes, you can achieve measurable improvements. Let your strategy be guided by the numbers, not guesswork.
Transforming Instagram follower growth data into visual formats turns overwhelming numbers into clear, actionable insights. By focusing on key metrics, selecting the right types of charts, and leveraging real-time dashboards, you can make informed decisions that fuel consistent growth. This process removes uncertainty, enabling precise adjustments to your strategy.
Instagram's native Insights tool only retains data for the past 90 days, which makes it challenging to recognize seasonal trends or long-term patterns. Visualization bridges this gap by creating historical records that safeguard critical data for future analysis.
The true strength of visualization lies in its ability to link follower surges to specific content, campaigns, or audience demographics. You can pinpoint which Reels, posts, or hashtags are driving growth and replicate those successes. For instance, smaller brands with fewer than 5,000 followers experience an average growth rate of 38% when they focus on the right metrics.
Tools like UpGrow take this process even further. With AI-powered tracking for over 50 metrics, real-time analytics, and automated 24/7 data collection, it removes the hassle of manual updates while ensuring your dashboard remains accurate. Rated 4.98/5 by over 58,000 users, UpGrow ensures data accuracy and simplifies performance tracking. Setting up daily refreshes at a fixed time allows you to monitor progress in real time without missing a beat.
To streamline the process of gathering Instagram follower data, you can leverage tools like APIs or data integration platforms that support scheduled data collection. Begin by selecting your preferred method - whether that's creating a simple script using an API or opting for a no-code platform to pull follower information. Once you've got it set up, you can schedule the data extraction to occur daily, weekly, or at any interval that suits your needs. The collected data can then be saved to a file or spreadsheet for further analysis.
If you'd rather skip the technical setup, services like UpGrow can simplify the process. They provide real-time analytics and a live dashboard, automatically tracking follower growth for you. This eliminates the hassle of manual scripting and offers built-in visual tools and growth-rate tracking to help you easily monitor and understand your Instagram performance over time.
To effectively track Instagram follower growth, line charts are a great go-to. They clearly show trends over time, making it easy to spot patterns like sudden spikes, steady increases, or declines. For instance, a line chart can display daily or weekly follower changes, giving you a straightforward way to monitor your progress.
Other chart options worth considering:
Pick the chart type that best fits the story you want to tell. For overall trends, stick with line or area charts. If you’re diving into details like growth sources or time-based comparisons, bar or stacked charts are a better choice.
To understand fluctuations in your Instagram follower growth - whether it's sudden spikes or stagnant periods - start by examining your daily follower changes. Tools like Instagram Insights or UpGrow's live analytics can help you track these variations. A spike in followers often points to a hit, like a viral post or a successful campaign. On the other hand, flat periods might indicate a lack of engagement or inconsistent posting.
When you notice a spike, take a closer look at the content you shared during that time. Was it a particular format, a well-timed post, or the use of certain hashtags that resonated? Identifying these patterns allows you to replicate what worked. For flat periods, evaluate your posting schedule, the variety in your content, and how actively you're engaging with your audience. Tools like UpGrow’s AI-driven growth features can also help you connect with new audiences and regain momentum. By analyzing these trends, you can fine-tune your approach and keep your follower count steadily climbing.


