Interactive Dashboards: Benefits for Instagram Growth
Real-time interactive dashboards beat static reports for Instagram growth—enabling live analytics, automation, and faster decisions.
Real-time interactive dashboards beat static reports for Instagram growth—enabling live analytics, automation, and faster decisions.
4.98 /5 - from 58k reviews
Trusted by 50,000+ creators — get real engagement delivered to your profile in minutes, not days.

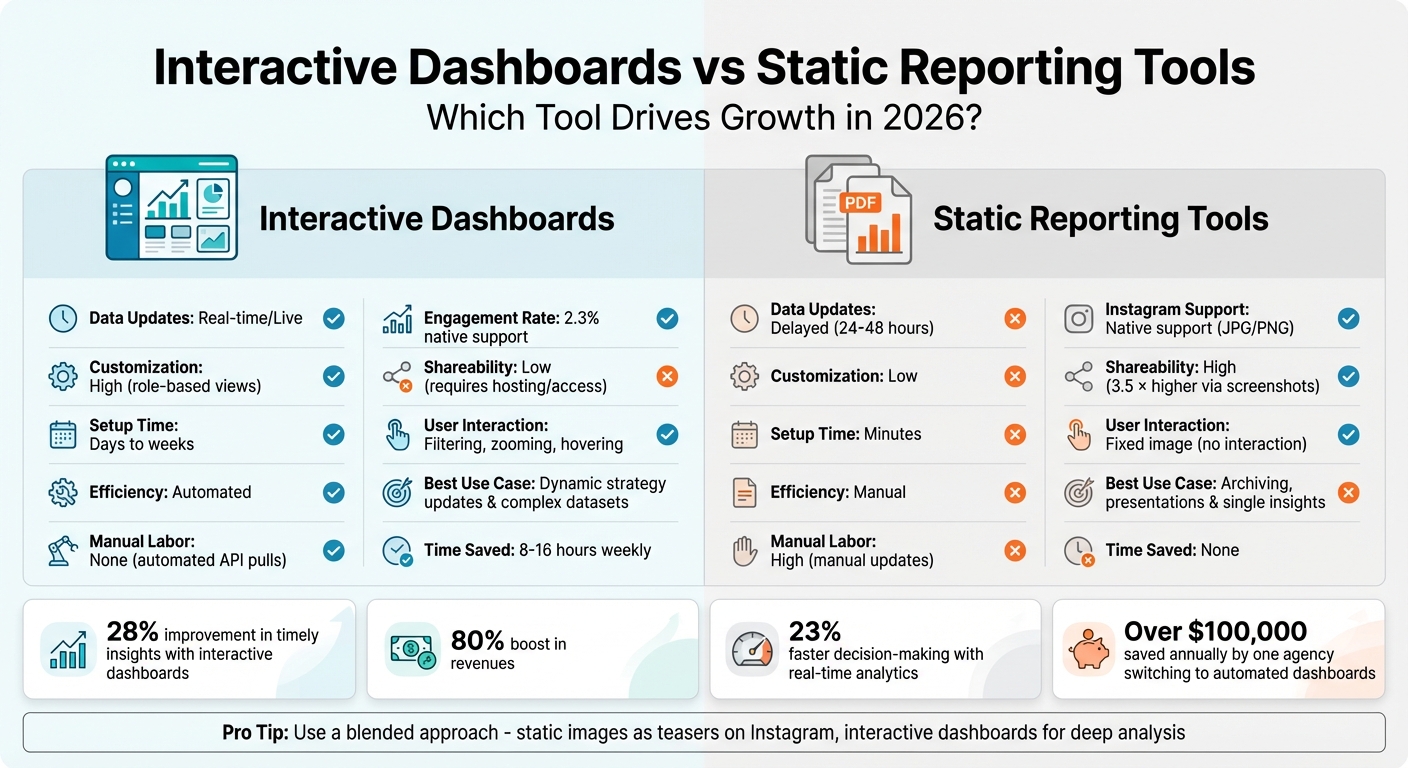
In 2026, Instagram marketers need tools that provide real-time insights to maximize growth. Interactive dashboards outperform static reporting tools by offering live data, automation, and customization, enabling faster and more informed decisions. While static tools like PDFs or Excel are useful for snapshots and presentations, they lack the immediacy and flexibility required for dynamic strategies.
| Feature | Interactive Dashboards | Static Reporting Tools |
|---|---|---|
| Data Updates | Real-time/live | Delayed (24–48 hours) |
| Customization | High (role-based views) | Low |
| Setup Time | Days to weeks | Minutes |
| Efficiency | Automated | Manual |
| Best Use Case | Dynamic strategy updates | Archiving or presentations |
For marketers aiming to grow on Instagram, interactive dashboards are essential for leveraging real-time data and making proactive decisions. Static tools, while simple and quick, are better suited for static reporting needs.
Interactive Dashboards vs Static Reporting Tools for Instagram Growth
Interactive dashboards connect directly to Instagram's API, delivering live data on key metrics like follower counts, engagement rates, and demographic trends. This real-time access is invaluable, especially during the crucial first 60–90 minutes after posting - a period that heavily influences whether Instagram's algorithm boosts your content's visibility.
One standout feature of interactive dashboards is the ability to track engagement velocity - how quickly your post garners likes, comments, and shares in its early stages. If momentum builds, you can immediately amplify the post by boosting it or sharing it to Stories for broader reach. These dashboards also help identify demographic mismatches in real time. For instance, if a post aimed at Gen Z audiences is instead resonating with users aged 35–44, you can tweak your approach within minutes. Automated alerts provide an extra layer of responsiveness by notifying you of significant metric shifts - like a 20% drop in engagement - allowing for immediate course correction.
Beyond tracking metrics, these dashboards offer tailored views to meet the unique needs of different team members.
Customizable dashboards go beyond just displaying data - they enable teams to act decisively and strategically. With role-based views, executives can focus on high-level summaries, campaign managers can monitor detailed KPIs, and analysts can dive deep into raw data. Their modular design allows users to rearrange widgets to prioritize specific goals, whether it's boosting brand awareness through reach or tracking product tag clicks for e-commerce.
Platforms like UpGrow enhance this flexibility by integrating real-time analytics with growth tools. Their live dashboards monitor follower growth and engagement around the clock, giving users the ability to fine-tune strategies based on the most current data.
Pairing these customizable features with automation tools further increases efficiency and streamlines operations.
Automation is a game-changer for marketing teams, saving them between 8–16 hours per week by eliminating the need for manual data compilation. Tim Akers, founder of Akers Digital, shared:
"We can get an entire reporting system together now in under 1-hour. This includes a variety of dashboards and automated monthly reports. It has saved us a TON of time".
One SEO agency even reported saving over $100,000 annually after switching from spreadsheets to automated dashboards.
Unlike interactive dashboards, static reporting tools provide fixed snapshots of data, such as PDF exports, Excel files, or Instagram's native Insights. These reports capture metrics like follower counts or engagement rates for a specific time period. While they’re handy for formal presentations or archiving historical data, they fall short when it comes to supporting active Instagram growth strategies.
A major limitation of static tools is their lack of real-time updates. For example, Instagram's native Insights can delay data by up to 48 hours, meaning decisions are often based on outdated performance metrics. This delay is especially problematic during the critical 60–90 minutes after posting, a window where engagement velocity plays a big role in whether Instagram's algorithm promotes your content.
Static reports also lack the ability to dive deeper into the data. As Onigrow explained:
"The key isn't just looking at numbers, but connecting them: comparing similar content, tracking trends over time, and understanding why one post performed better than another. This is also where Insights shows its limits".
Without the ability to drill down or track trends dynamically, static tools can leave you guessing about the "why" behind your metrics.
Another challenge with static reports is the manual effort they require. Every time you need updated data, you have to compile, format, and recreate the report from scratch. As your data grows, this process becomes increasingly time-consuming, making it harder to scale your Instagram monitoring efforts.
Automated dashboards, on the other hand, update continuously through API connections, eliminating the need for repetitive manual work. In fact, switching to automated platforms can cut the time spent on report preparation by over 80%. One analyst at Signal Theory Inc. shared:
"Reports that used to take hours now only take about 30 minutes. We're reporting for significantly more clients, even though it is only being handled by a single person".
For teams managing multiple Instagram accounts or running time-sensitive campaigns, the efficiency of automated tools is a game-changer. Static tools simply can’t compete with the speed and flexibility of real-time dashboards, which are better suited for driving proactive Instagram growth strategies.
Choosing between interactive dashboards and static reporting tools for Instagram growth requires understanding their strengths and limitations. Each option serves different needs, so the right choice depends on your goals and how you plan to use performance metrics.
Interactive dashboards shine when real-time decision-making and automation are priorities. Thanks to API connections, they continuously update, ensuring you're always working with the latest data. This is a big deal - companies using real-time analytics make decisions 23% faster compared to those relying on traditional reporting methods. However, these dashboards come with challenges. Setting them up can take days or even weeks, and the complexity of managing numerous metrics can sometimes lead to "alert fatigue".
Static tools, on the other hand, are quick to create and easy for viewers to engage with. They can be set up in minutes and integrate seamlessly with Instagram's native support for static image formats like JPG or PNG. These tools also tend to perform well on social media, achieving an average engagement rate of 3.8%, compared to 2.3% for posts linking to interactive dashboards. Plus, they're 3.5 times more shareable since users can easily screenshot and share them. The downside? Static reports provide only a snapshot of your data and require manual updates, which increases the risk of errors as your dataset grows.
Here's a side-by-side comparison to break it down further:
| Feature | Interactive Dashboards | Static Reporting Tools |
|---|---|---|
| Data Freshness | Real-time/Live updates | Stale/Point-in-time |
| Setup Time | High (days to weeks) | Low (minutes) |
| Manual Labor | Automated | Manual |
| Instagram Support | No native support (external link) | Native support (JPG/PNG) |
| Engagement Rate | 2.3% average | 3.8% average |
| Shareability | Low (requires hosting/access) | High (3.5× higher via screenshots) |
| User Interaction | Filtering, zooming, hovering | Fixed image (no interaction) |
| Accuracy | High (automated API pulls) | Prone to human copy-paste errors |
| Best Use Case | Complex datasets with multiple angles | Single, clear insight communication |
For many campaigns, a blended approach works best. Static images can act as "teasers" on Instagram, showcasing a key insight to drive quick engagement. You can then link to an interactive dashboard for users who want to dive deeper. Tools like UpGrow make this hybrid strategy possible by combining live dashboards with detailed reports. Matching the right tool to your campaign's needs is key, as highlighted in the conclusion.
Real-time data is the backbone of Instagram growth. Success on the platform depends on quick, informed decisions, and that's where interactive dashboards shine. While static tools provide shareable snapshots, they lack the up-to-the-minute insights necessary for seizing viral opportunities or making rapid adjustments. In contrast, interactive dashboards offer live updates, enabling you to refine targeting, identify high-performing content, and act on trends instantly.
According to research, using interactive dashboards can lead to a 28% improvement in timely insights, an 80% boost in revenues, and save teams between 8 and 16 hours each week.
"A social media dashboard brings everything - analytics, scheduling, engagement, and reporting - into one place, making real-time decisions easier." – Karishma Borkakoty, Content Marketer
These tools directly address the limitations of Instagram's native Insights. While native Insights lack robust real-time analytics and require manual reporting for deeper analysis, external dashboards fill the gap. They allow marketers to analyze long-term trends, access data on desktop platforms, and drill into specific demographics or content types without delays. This level of clarity and accessibility empowers teams to adjust strategies on the fly with confidence.
For those looking to supercharge their Instagram growth, UpGrow offers a solution with 24/7 live dashboards and real-time analytics. Starting at just $39 per month, their plans include automated targeting, performance tracking, and a growth guarantee - no spreadsheets or guesswork needed.
In the first 60–90 minutes after posting on Instagram, keep a close eye on how your content is performing. Use tools like real-time analytics or interactive dashboards to track key metrics, including engagement rate, likes, comments, and follower activity. This immediate feedback helps you spot trends and understand how your audience is reacting. During this crucial time frame, you can make quick adjustments - like replying to comments or taking steps to boost your post’s visibility - to ensure you’re making the most of this high-engagement period.
A live Instagram dashboard provides a snapshot of essential metrics, such as follower growth, reach, impressions, engagement rate, content interactions, and audience demographics. These real-time updates are crucial for assessing account performance, understanding how your content resonates, and tracking audience behavior.
By monitoring metrics like follower count, engagement levels (likes, comments, shares), and demographic insights, you can make quick, informed adjustments to your content and strategies to drive growth effectively.
Static reports work well when you need straightforward, standalone visuals to convey a single point quickly - perfect for grabbing attention on platforms like Instagram. Dashboards, however, are more suited for ongoing analysis and supporting long-term strategic decision-making.
Share this post


