Instagram vs TikTok in 2026: 40+ Statistics on Users, Engagement & Commerce
2026 stats on users, engagement, ad revenue and shopping — Instagram leads in scale and monetization; TikTok wins on attention and discovery.
2026 stats on users, engagement, ad revenue and shopping — Instagram leads in scale and monetization; TikTok wins on attention and discovery.
4.98 /5 - from 58k reviews
Trusted by 50,000+ creators — get real engagement delivered to your profile in minutes, not days.
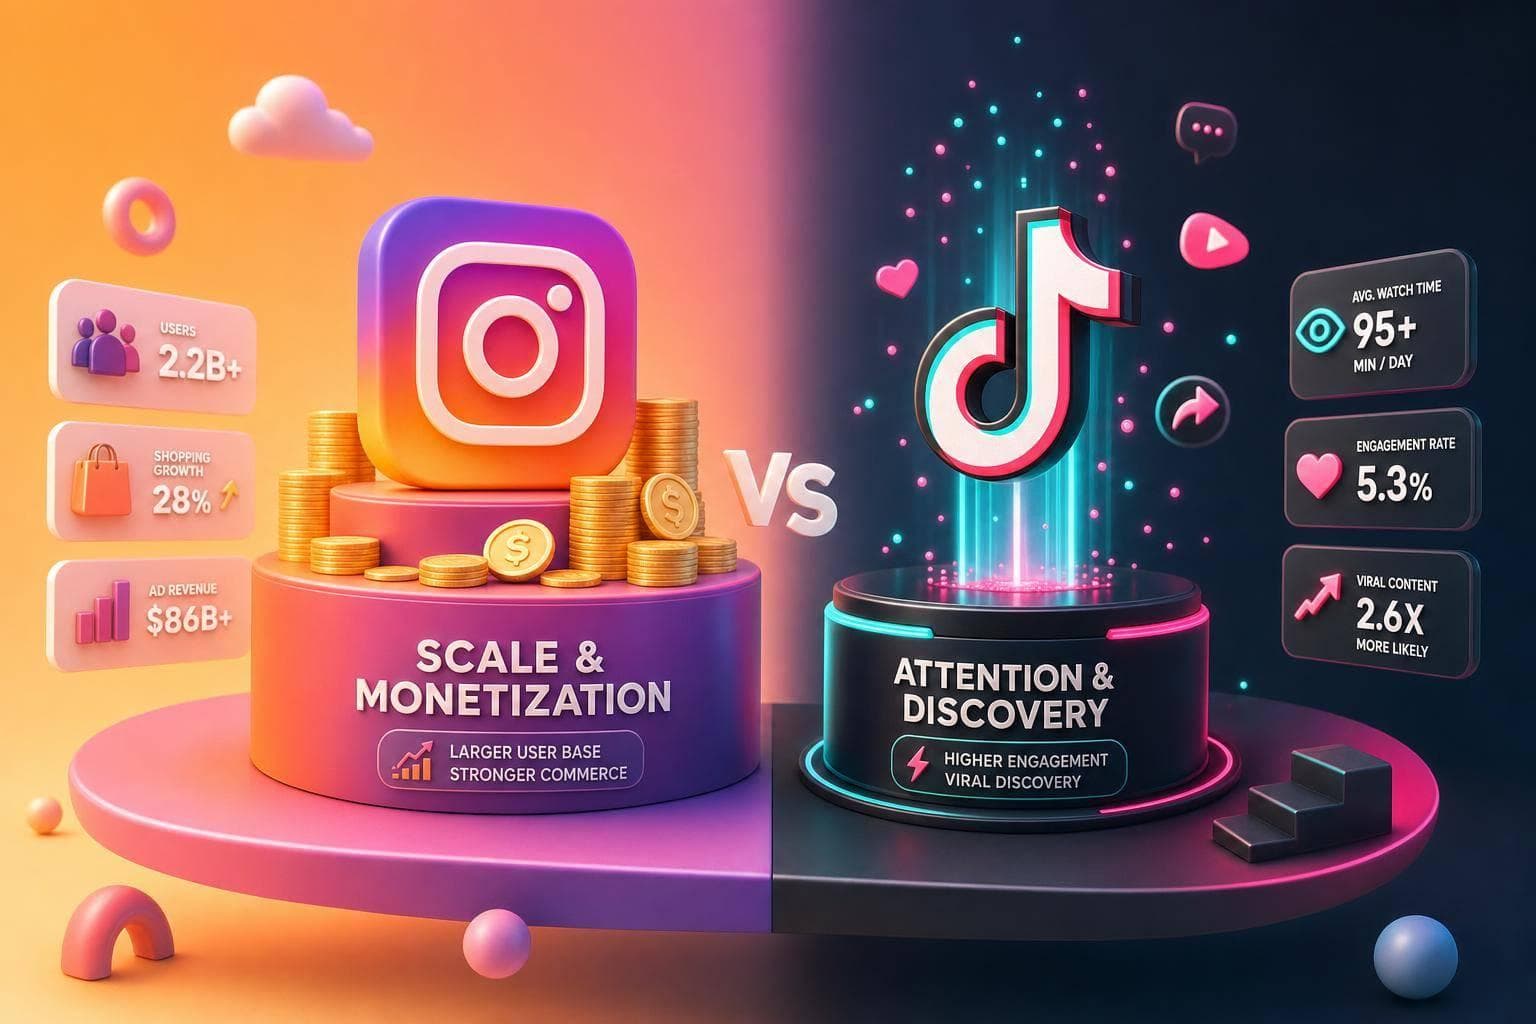
If you want the short answer: Instagram is bigger and makes more money, while TikTok gets more attention.
I found the split simple. Instagram has 2.14 billion monthly active users vs. TikTok’s 1.9 billion. But TikTok leads in time spent, with 53.8 minutes per day in the U.S. vs. 33 minutes for Instagram. That means Instagram is the better pick for scale, ads, and sales, while TikTok is the better pick for engagement, discovery, and in-app shopping.
If you’re choosing where to put time or budget, here’s the fast read:
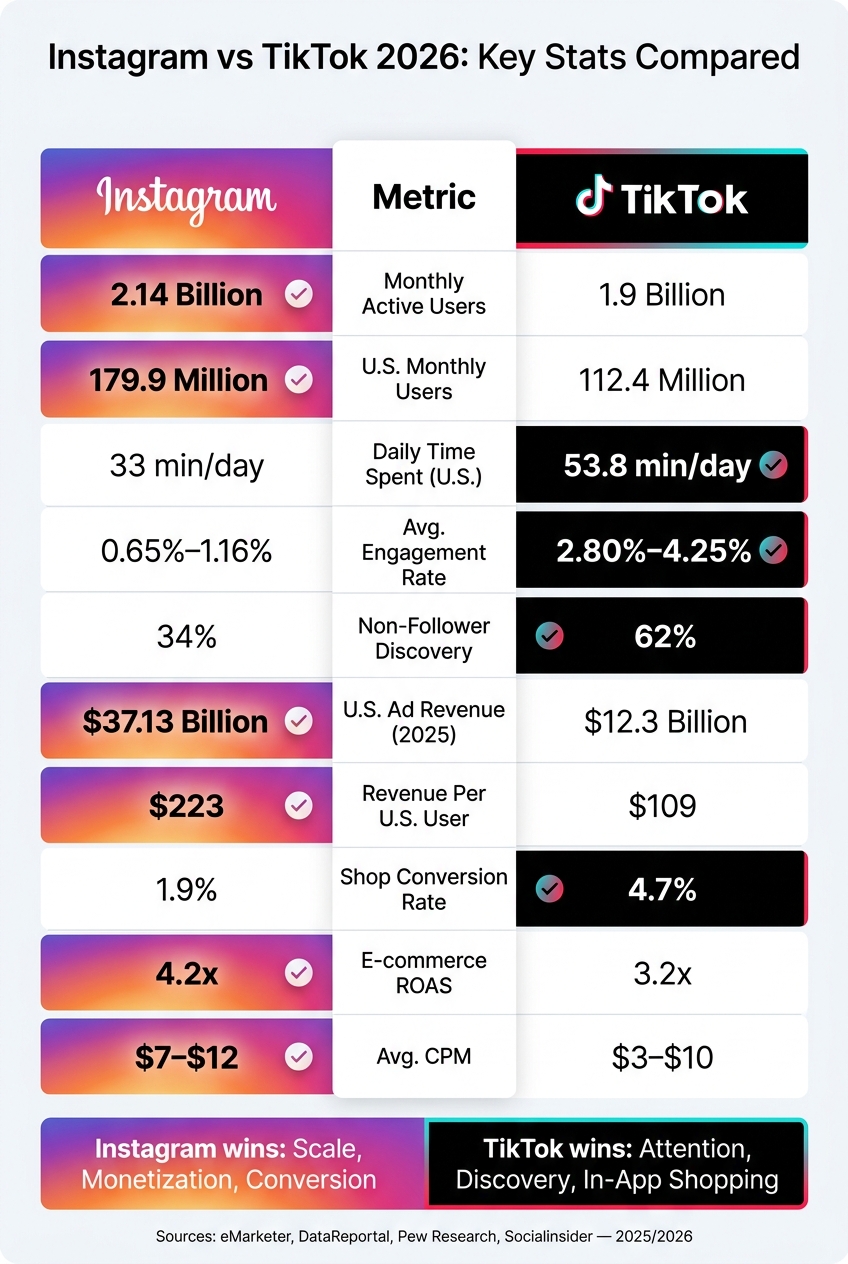
Instagram vs TikTok 2026: Key Stats Compared
| Criteria | TikTok | |
|---|---|---|
| User scale | Larger | Smaller |
| Time spent | Lower | Higher |
| Engagement rate | Lower | Higher |
| Follower reach | Higher | Lower |
| Non-follower discovery | Lower | Higher |
| U.S. ad revenue | Higher | Lower |
| Revenue per U.S. user | Higher | Lower |
| CPM/CPC | Higher | Lower |
| Direct-response performance | Stronger | Weaker |
| In-app shop conversion | Lower | Stronger |
| Main age strength | 25–34 | 18–24 |
My takeaway: if you want reach and conversion, Instagram is ahead. If you want attention and discovery, TikTok is ahead. Many brands will still need both: TikTok to get seen, Instagram to close the sale.
These figures don't all measure the same thing. MAUs count monthly active accounts. Ad-reachable audience estimates how many users advertisers can target. Survey-based penetration shows how much of a given population uses a platform. So, user totals tell you about reach. Engagement tells you where people spend their time.
Instagram reached 2.14 billion MAUs globally in Q1 2026. TikTok reached 1.9 billion MAUs in early 2026, up from 1.59 billion at the start of 2025.
So yes, Instagram is still ahead on monthly scale. But that lead doesn't automatically mean people use it more every day.
That lead shows up in the U.S. too, although the gap gets smaller with younger users.
In the United States, Instagram has 179.9 million monthly users compared with TikTok's 112.4 million. Based on Pew Research survey data, that works out to about 50% of U.S. adults on Instagram versus roughly 33% on TikTok.
| Metric | TikTok | Source | Year | |
|---|---|---|---|---|
| U.S. Monthly Users | 179.9 million | 112.4 million | Statista / eMarketer | 2025 |
| U.S. Adults (Total) | ~50% | ~33% | Pew Research | 2024/2025 |
| Ages 18–29 | 78% | 62% | Pew Research | 2024/2025 |
| Ages 30–49 | 59% | 39% | Pew Research | 2024/2025 |
| Ages 50–64 | 35% | 24% | Pew Research | 2024/2025 |
| Ages 65+ | 15% | 10% | Pew Research | 2024/2025 |
Instagram leads across every adult age group in the U.S. Still, TikTok's strongest momentum now comes from older groups, not just younger ones. For marketers, that's the key split: Instagram gives you more total coverage, while TikTok tends to hold more attention among younger audiences.
Those user gaps lead straight into the engagement comparison next.
Once audience size is clear, engagement tells you where people are paying attention. TikTok wins on raw engagement. Instagram wins on reach and conversion.
TikTok's average engagement rate lands between 2.80% and 4.25%, while Instagram Reels sit at 0.65% to 1.16%. Among smaller accounts with under 10,000 followers, TikTok hits 7.50% engagement compared with 3.45% on Instagram.
That edge doesn't disappear as accounts grow. For profiles with more than 1 million followers, TikTok still posts 2.9% to 4.2% engagement, while Instagram usually falls below 2% at that size.
People also spend more time watching on TikTok. Users go through about 265 videos per day, versus 177 on Instagram. That said, Instagram has one format that can punch above Reels: carousels. Some reports put carousel engagement at 10.15%, compared with 5.53% for Reels, helped by saves and shares.
So yes, TikTok tends to pull more likes, comments, shares, and watch time. But the reason isn't random. It comes down to how each platform serves content.
TikTok is discovery-first; Instagram is follower-first. On TikTok, the algorithm leans hard on watch time and content performance, not follower count. That system drives 85% of video views. Instagram still gives more weight to existing audience ties, and 57% of views come from its algorithm.
You can see that split in the reach data. Instagram Reels reach about 62% of an account's followers, while TikTok reaches 38% of followers. For brands and creators with an established audience, Instagram tends to offer steadier distribution, which you can verify using an Instagram influencer comparison tool. For someone starting from zero, TikTok is often the faster way to get seen.
Then the story flips when money enters the picture. Instagram Reels ads convert at 1.3x the rate of TikTok ads for direct sales. Instagram followers also convert into paying customers at a rate 2.7x higher than followers sourced from TikTok. And Instagram's average referral order value comes in at $68, compared with $51 on TikTok.
| Metric | TikTok | Winner | Source | Year | |
|---|---|---|---|---|---|
| Avg. Engagement Rate | 0.65%–1.16% | 2.80%–4.25% | TikTok | Socialinsider / Sprout Social | 2026 |
| Daily Time Spent (U.S.) | 33 min | 53.8 min | TikTok | DataReportal | 2026 |
| Median Follower Reach | 62% | 38% | DataReportal | 2025 | |
| Algorithm-Driven Views | 57% | 85% | TikTok | Hootsuite | 2026 |
| Ad Conversion Rate | Up to 9% | Up to 7% | DataReportal | 2026 | |
| Avg. Order Value (AOV) | $68 | $51 | 2026 |
That split leads straight into the next part: which platform does a better job turning attention into ad results and sales?
That gap shows up most clearly in ad pricing, shopping behavior, and creator earnings.
Instagram brought in $37.13 billion in U.S. ad revenue in 2025, compared with $12.3 billion for TikTok. Worldwide, Instagram reached $54.7 billion, while TikTok hit $33.1 billion.
TikTok, however, is growing at a faster clip. Its ad business grew 32% year over year, versus 12% for Instagram. On cost, TikTok is usually the cheaper option. Its average CPM sits at $3–$10, compared with $7–$12 on Instagram, and its average CPC is $0.31 versus $0.79.
That matters for paid reach. Lower CPMs can help TikTok stretch budget further, especially for top-of-funnel campaigns. Instagram tells a different story on monetization: it generates $223 in revenue per U.S. user, compared with $109 for TikTok.
TikTok Shop keeps growing fast. In the U.S., TikTok Shop sales reached $15.82 billion in 2025 after a 120% year-over-year increase. Globally, TikTok Shop's GMV could reach as much as $87 billion by the end of 2026.
But scale is only part of the picture. Conversion data points in TikTok's favor: TikTok Shop posts a 4.7% conversion rate, more than double Instagram Shopping's 1.9%. At the same time, Instagram still comes out ahead on direct-response return, with 4.2x average ROAS for e-commerce versus 3.2x for TikTok.
Put simply, TikTok is strong at driving impulse purchases, while Instagram tends to finish higher-ticket orders. And TikTok's shopping habit looks pretty sticky: 49.7% of TikTok social shoppers make a purchase at least once per month.
The same pattern shows up in creator pay. Instagram Reels bonuses pay $0.50–$2.50 per 1,000 views, while TikTok's Creator Rewards Program pays $0.40–$1.00 per 1,000 views.
Sponsorship pricing follows suit. Instagram creators earn $10–$25 per 1,000 followers, compared with $5–$15 for TikTok creators. On top of that, Instagram followers are estimated to be worth up to 10x more per follower than TikTok's.
For marketers, the pattern is pretty clear. Instagram wins when the goal is stronger monetization, better ROAS, and higher creator earnings. TikTok wins on lower reach costs, faster ad growth, and stronger in-app shopping conversion.
| Metric | TikTok | Winner | Source | Year | |
|---|---|---|---|---|---|
| U.S. Ad Revenue | $37.13 billion | $12.3 billion | eMarketer | 2025 | |
| Global Ad Revenue | $54.7 billion | $33.1 billion | eMarketer | 2025 | |
| Ad Revenue Growth (YoY) | 12% | 32% | TikTok | eMarketer | 2025 |
| Avg. CPM | $7–$12 | $3–$10 | TikTok | Sprout Social | 2025 |
| Avg. CPC | $0.79 | $0.31 | TikTok | Socialinsider | 2025 |
| Revenue Per U.S. User | $223 | $109 | eMarketer | 2025 | |
| Shop Conversion Rate | 1.9% | 4.7% | TikTok | Platform reports | 2025 |
| E-commerce ROAS | 4.2x | 3.2x | Socialinsider | 2025 | |
| Creator Pay (per 1K views) | $0.50–$2.50 | $0.40–$1.00 | Platform disclosures | 2026 |
Across ad revenue, ROAS, and creator pay, Instagram leads on monetization. TikTok leads on volume, reach cost, and in-app conversion rate. That leaves the final question: what does this mix mean for marketers?
After looking at users, engagement, reach, and commerce, the takeaway is pretty simple. The 2026 numbers don’t point to one platform beating the other across the board. They point to a split: Instagram wins on scale and monetization, while TikTok wins on attention and discovery.
Instagram leads on scale and monetization. It has 2+ billion monthly active users, brought in $37.1 billion in U.S. ad revenue in 2025, and generated $223 in revenue per U.S. user. On top of that, Reels convert 1.3x better than TikTok ads for direct-response campaigns.
TikTok leads on attention and discovery. In the U.S., users spend 53.8 minutes per day on TikTok versus 33 minutes on Instagram. Its feed also gives non-follower discovery more room, which helps new content spread faster.
For marketers, that leads to a simple framework: TikTok for reach, Instagram for conversion. If your brand is focused on Instagram growth strategies, the point isn’t just to build a big audience. It’s to build one that’s real, active, and ready to act. That’s where UpGrow comes in: AI-powered targeting, real human IG experts, and live analytics built to help brands grow organically.
Last updated: July 2026
As of early 2026, Instagram still edges out TikTok in total monthly active users.
Instagram has about 2 billion monthly active users. TikTok is close behind at 1.9 billion.
So yes, Instagram remains larger in overall scale.
That said, TikTok picked up speed in 2025. It added roughly 300 million users, which means its growth outpaced Instagram’s during that period.
TikTok tends to drive higher engagement than Instagram in 2026. Reported average engagement rates sit around 2.80%–4.80% for TikTok, compared with 0.48%–1.48% for Instagram.
A big reason is TikTok’s discovery-based algorithm. It pushes posts to new people more aggressively, which gives content more chances to get views, likes, comments, and shares.
Instagram lags behind on raw engagement. But it often does a better job with conversion efficiency and building a deeper connection with an audience.
Instagram brings in more ad revenue than TikTok.
In 2025, Instagram generated $37.1 billion in U.S. ad revenue, compared with TikTok’s $12.3 billion. On the global side, Instagram reached $54.7 billion, while TikTok brought in $33.1 billion.
TikTok is growing faster year over year. Its ad revenue climbed 32%, compared with Instagram’s 12%. Still, Instagram remains ahead in total ad spend.
It depends on your goals, your audience, and where you are in your marketing cycle.
Share this post