Why Is My Instagram Reach So Low in 2026? A Diagnostic Checklist
A six-step checklist to diagnose and fix low Instagram reach in 2026: account flags, reposts, Reel hooks, cadence, and shadowbans.
A six-step checklist to diagnose and fix low Instagram reach in 2026: account flags, reposts, Reel hooks, cadence, and shadowbans.
4.98 /5 - from 58k reviews
Trusted by 50,000+ creators — get real engagement delivered to your profile in minutes, not days.
If your Instagram reach is down in 2026, I’d check six things first: a reporting glitch, an account flag, reposted content, a weak Reel opening, posting gaps, or a visibility limit. I’d also make sure I’m not comparing old impressions to today’s views, because Instagram changed its main metric in April 2025.
Here’s the short version:
Before I change my whole posting plan, I’d run a simple check in order: Account Status first, then compare my recent posts to a longer baseline, then look at reposts, Reel retention, posting frequency, and non-follower traffic from Explore or hashtags.
| Check | What I’d look for | Warning sign |
|---|---|---|
| Metric change | Old impressions vs. new views | Bad comparison |
| Account Status | Recommendation eligibility | Flag or ineligible notice |
| Original posts | Reposts in past 30 days | 10+ reposts |
| Reels opening | 3-second retention | Under 40% |
| Posting rhythm | Last 60 to 90 days | 5+ day gaps |
| Discovery traffic | Explore/hashtag reach | Non-follower reach under 5% |
The main idea: I wouldn’t guess. I’d find the first thing that broke, fix that, and then watch the next 3 to 5 posts before changing anything else.
Start by making sure the drop is actually a pattern, not just one bad post.
A real reach drop usually shows up across 3 to 5 consecutive posts, tracked over a 7- to 14-day window and compared against your 28- to 90-day baseline.
Before you dig into content, check Account Status. This comes first because flagged content or recommendation ineligibility can override everything else. Go to Settings and activity → Account Status to see whether any content has been flagged or whether your account is marked ineligible for recommendations.
If Account Status is clean, look at three numbers next. They’ll tell you if the issue is distribution, engagement, or discovery.
People mix these up all the time. That’s where bad diagnosis starts.
Reach is the number of unique accounts that saw your content. Impressions are the total times your content was shown, including repeat views from the same person. Views are the main metric in 2026, and watch time is the biggest driver behind them.
Here’s the simple read:
Pull these three numbers from Instagram Insights before you touch your posting style, cadence, or format.
They help you spot what broke first, so you know where to look next: flags, originality, hooks, cadence, or restrictions.
| Metric | Formula | What It Indicates | Directional Benchmark |
|---|---|---|---|
| Reach-to-Follower Ratio | (Total Reach ÷ Total Followers) × 100 | How well your content reaches your current audience | 10%–20% |
| Save Rate | (Total Saves ÷ Total Reach) × 100 | Utility and reference value; a high-intent signal for Explore distribution | No fixed public benchmark; higher is better. |
| Share/Sends Rate | (Total Shares ÷ Total Reach) × 100 | How often people send your content in DMs; the strongest signal for non-follower discovery | 0.5%–2.0% for healthy creator accounts. |
These ranges vary by source, so don’t treat them like hard rules. Think of them as guide rails.
If your sends rate stays below 0.5%, start there. And if non-follower reach drops below 5% across 3 to 5 posts, that’s a strong sign it’s time to move to the checklist.
Once you know which metric broke first, move to the six-step diagnostic checklist.
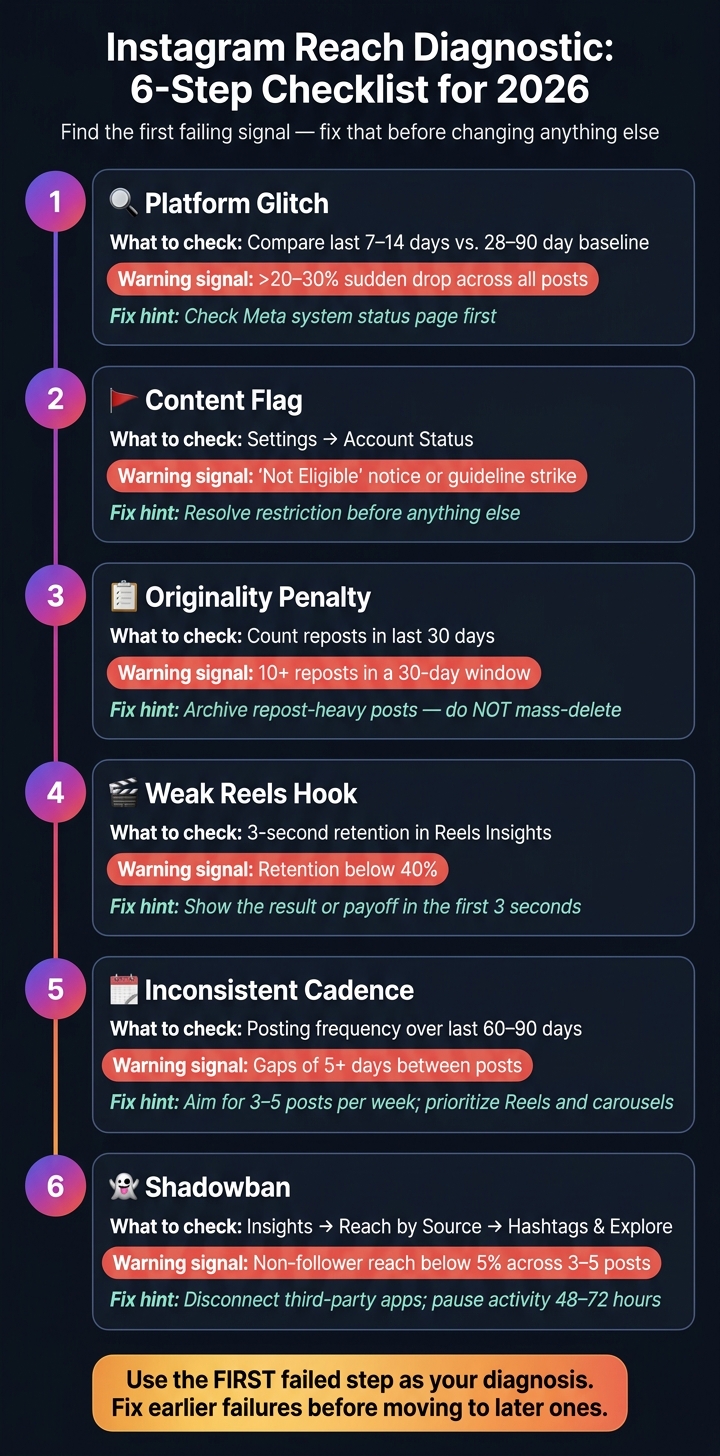
Instagram Reach Diagnostic: 6-Step Checklist for 2026
Use this checklist to find the first signal that's failing.
Compare your last 7–14 days against your 28–90 day baseline. A change under 10% is normal. A drop of 20–30% means you should take a closer look. If the decline is sudden and shows up across the board, check Meta's system status page before you do anything else.
Open Settings → Account Status and look for recommendation ineligibility or any guideline strikes. If there's a restriction, deal with that first.
Look at your last 30 days of posts and count reposts or reused clips. If your original posts get about 3x more non-follower reach than reposts, that includes posts with watermarks or reused audio, then originality is probably hurting distribution.
The fix: Archive repost-heavy posts. Don't mass-delete them.
If Steps 1–3 look clean, the issue is likely post performance rather than account-level distribution. Check your 3-second retention in Reels Insights. Above 60% is a good sign. Below 40% usually points to a weak hook.
The fix: Show the result or payoff in the first 3 seconds. Then explain how you got there.
Map your posting frequency across the last 60–90 days and watch for gaps of 5 or more days. Long breaks kill momentum. Aim for 3–5 posts per week, with Reels and carousels taking priority.
A shadowban isn't just a hunch. It shows up as a clear drop in non-follower reach. Go to Insights → Reach → Reach by Source and review your Hashtags and Explore numbers across the last 3–5 posts.
If a restriction is confirmed, disconnect any third-party apps that asked for your Instagram password and pause activity for 48–72 hours.
| Diagnostic Step | What to Check | Problem Signal |
|---|---|---|
| 1. Glitch | Insights: 7–14d vs. 28–90d baseline | >20–30% sudden drop |
| 2. Content Flag | Settings → Account Status | "Not Eligible" or guideline notice |
| 3. Originality | Last 30 posts: repost count | 10+ reposts in 30 days |
| 4. Reels Hook | 3-second retention in Reels Insights | <40% hold rate |
| 5. Cadence | Posting frequency over last 60–90 days | Gaps of 5+ days |
| 6. Shadowban | Reach by Source: Hashtags/Explore | Non-follower reach <5% across 3–5 posts |
Use the first failed step as your main diagnosis. Fix earlier failures before you move to later ones. Once you've found it, the next section shows how to read that result and decide what to fix first.
Start with the first failed step. That’s your main diagnosis.
If you change a bunch of things at the same time, you won’t know what caused the drop or what helped fix it. So go through the checklist in order. The first step that fails is usually the main reason performance slipped.
If Step 3 failed, the drop is likely an originality issue, not just a random swing.
Yes - reposting can lower reach when it turns into a pattern instead of a one-off. In 2026, Instagram excludes accounts that post 10 or more reposts and unoriginal content within a rolling 30-day window from recommendation surfaces. That can pull your posts out of Explore, the Reels feed, and Suggested for You, even if your current followers still see them.
A steep drop in non-follower reach after a repost-heavy stretch is a strong sign of an originality penalty. If repost-heavy posts lose non-follower reach fast, Step 3 is likely the cause.
Use these ratios to tell the difference between a content issue and a distribution issue.
15–25% for creator accounts and 8–15% for business accounts. If you keep landing below 8%, your account may be sitting in a weaker distribution bucket. Average organic Instagram reach across account types is about 7.6% of followers in 2025–2026 - around 40% lower than in 2023.
| Metric | Healthy Range | Red Flag |
|---|---|---|
| Reach-to-Follower Ratio (Creator) | 15–25% | < 8% |
| Reach-to-Follower Ratio (Business) | 8–15% | < 5% |
| Save Rate | > 2% | < 0.5% |
| Share Rate (Sends-per-Reach) | 0.5–2% | < 0.3% |
Here’s the simple read:
The metric that matters most for non-follower distribution in 2026 is sends-per-reach. A DM share carries far more weight than a like when Instagram decides how far to push a post. If your share rate is below 0.3%, people may be seeing the post, but they’re not passing it along.
Use the pattern that matches your numbers to decide what to fix first.
Start with the first failed step from your checklist. Fix that one before you change anything else. Once you know where the breakdown happened, handle that first - then pause and measure the result before you move to the next thing.
If one issue is flagged, deal with that first. After that, get back to the basics: original posts, stronger Reels hooks, and a steady posting rhythm of 3–5 posts per week. If you think certain posts may have triggered a penalty, archive them instead of deleting them. Mass-deleting can make your account look compromised to Instagram and can slow recovery. Then watch non-follower reach on your next 3 to 5 posts to see whether distribution starts coming back.
Most of the time, low reach comes down to a content problem. But audience quality can also slow things down. If the issue is weak engagement instead of a flag, then audience quality becomes part of the fix. Real followers matter because they drive the saves and shares that help distribution recover.
If your checklist points to weak engagement signals instead of a technical flag, the problem is often audience quality. Ghost followers and inactive accounts can pull down your engagement-per-reach ratio. And that tells Instagram your content may not deserve more distribution.
UpGrow helps tackle that issue at the source. Its AI-powered targeting connects your account with engaged, niche-relevant followers - people who are more likely to care about what you post, save it, and share it. UpGrow’s live analytics dashboard also lets you watch reach trends in real time, so you can catch a drop early instead of figuring it out weeks later.
If you want to dig into the cause of your drop, these guides can help: reasons your reach suddenly dropped, how algorithm changes impact engagement, and - if your non-follower reach is still close to zero after you work through the checklist - the step-by-step guide to fix an Instagram shadowban.
Don’t change your content strategy until you’ve identified the exact cause of the reach drop with diagnostic testing. Most drops can be reversed within 7 to 14 days once you fix the right issue.
After you apply the matching fix, wait 7 to 14 days for signals to settle. If you’re doing a formal reset for the originality penalty, recovery may take 14 to 21 days. Avoid making broad changes all at once.
No. One bad Reel usually does not mean your reach is dropping.
Performance goes up and down. That’s normal. Sometimes a post just misses with the first group Instagram shows it to, and the numbers never quite pick up. One weak Reel is often just an outlier, not a signal that your account is slipping.
A real reach drop looks more like a pattern: a steady decline in non-follower reach across three to five posts. If only one Reel underperforms, check Account Status for any eligibility flags. If nothing is flagged, keep posting and avoid drastic changes.
Don’t change your content strategy yet.
Start with an ordered triage. First, rule out a platform-wide outage. Then check Account Status for guideline flags or recommendation limits, and review recent posts for reposted or unoriginal content.
If those checks come back clean, look at performance signals like the 3-second hook rate on your recent Reels. Then fix the specific problem first, whether that means archiving flagged content, cutting back on reposts, or rewriting your hooks.


