
Instagram DM Reporting Tools: 2026 Guide
Track Instagram DMs from first message to revenue with the right metrics, tools, attribution, and exports for reliable sales reporting.
Track Instagram DMs from first message to revenue with the right metrics, tools, attribution, and exports for reliable sales reporting.
4.98 /5 - from 58k reviews
Trusted by 50,000+ creators — get real engagement delivered to your profile in minutes, not days.
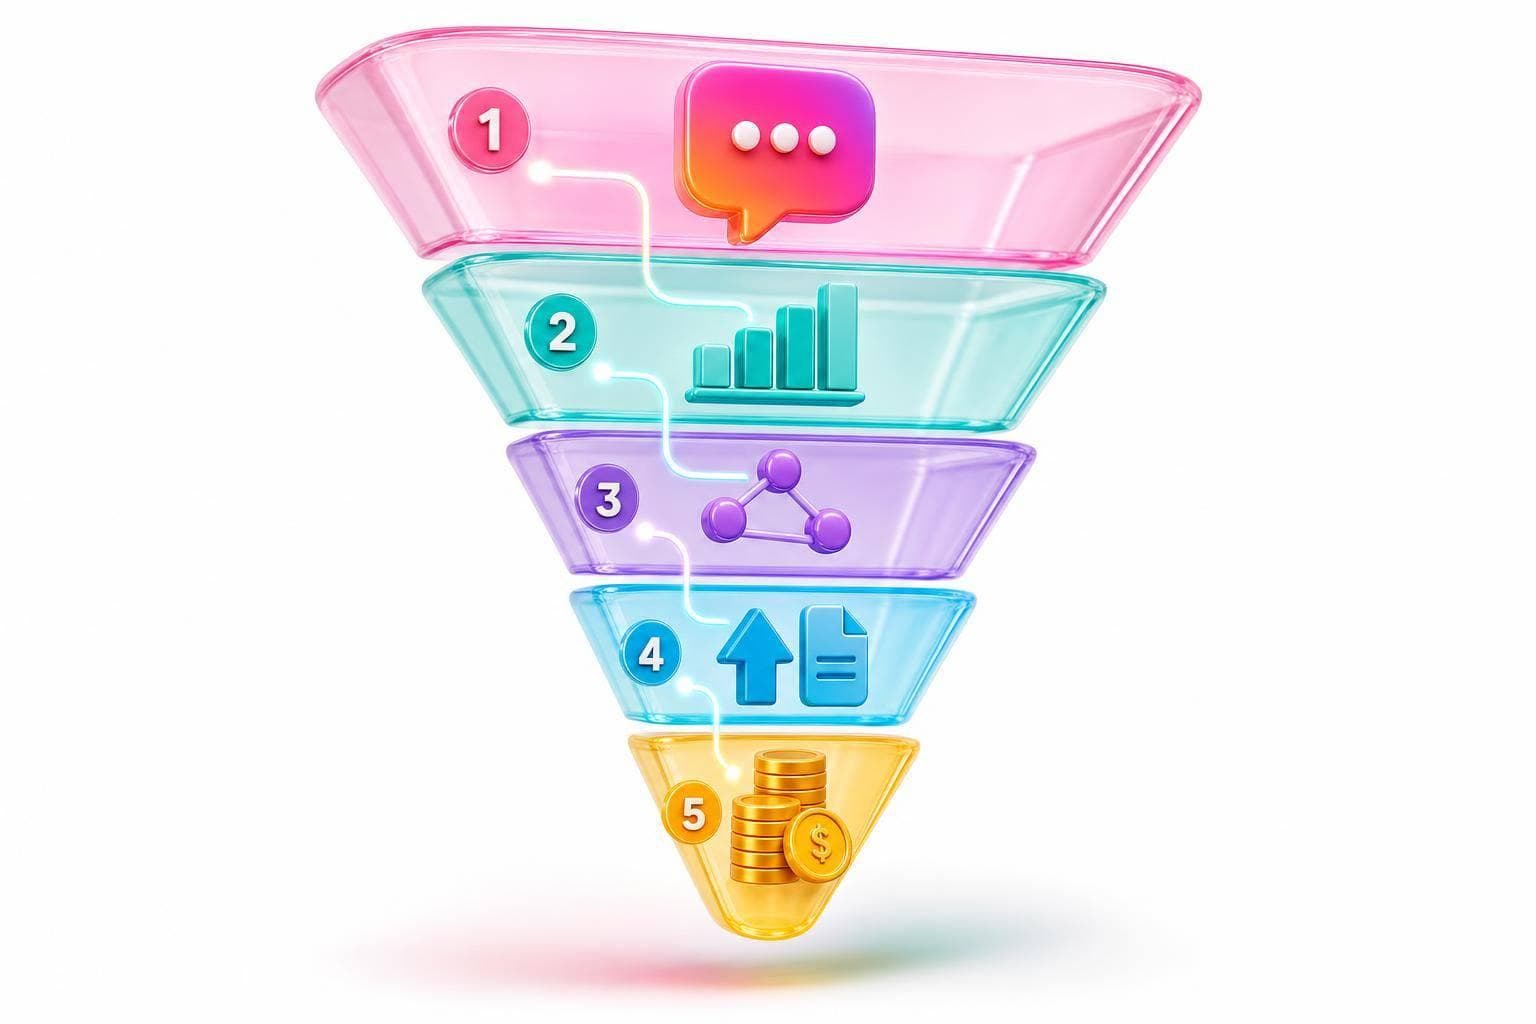
If I want Instagram DMs to drive sales, I need to track more than message count. In 2026, the numbers that matter are: conversations started, reply speed, human vs. automated replies, qualified leads, booked calls, sales, and revenue tied to those chats.
Here’s the short version:
A simple setup can turn 300 messages into a clearer funnel view, such as 110 leads, 42 qualified chats, 15 bookings, and 6 sales. That is the difference between inbox noise and a report I can act on.
Quick comparison
| Tool | Best for | Main limit |
|---|---|---|
| Instagram Insights | Seeing what content drove DM interest | No chat-level or sales tracking |
| Meta Business Suite | Viewing inbox activity and reply metrics | Limited owner and revenue reporting |
| CRM / DM dashboard | Tracking leads, team handling, bookings, and revenue | Needs setup, naming rules, and clean data |
If I want clean reporting, I need one simple rule: track the full path from first message to closed revenue, not just inbox volume.
The metrics that matter most tie DM activity to lead quality and revenue. But that only works if each metric has a clear definition. If one person counts a "qualified conversation" one way and someone else counts it another way, the numbers fall apart fast.
Start with the basics: how many conversations began, how many stayed active, and how your team handled them.
| Metric | Definition | Formula | Business use |
|---|---|---|---|
| Conversations started | Unique DM threads initiated during the reporting period | Count of new conversation threads | Measures demand generated by content, campaigns, or ads |
| Active conversations | Threads with at least one exchange or unresolved status during the period | Count of qualifying active threads | Helps estimate current workload |
| Messages sent | Total outbound messages from the team or automation | Count of sent messages | Measures communication workload and follow-up effort |
| Messages received | Total incoming customer messages | Count of received messages | Indicates audience interest and customer effort |
| Reply rate | Share of eligible inbound messages that received a brand reply | (Inbound messages receiving a reply ÷ eligible inbound messages) × 100 | Measures whether the team is engaging with inquiries |
| First-response rate | Share of new conversations receiving an initial brand response within a defined service-level target | (New conversations answered within target ÷ eligible new conversations) × 100 | Measures responsiveness at the point when a lead or customer first reaches out |
| Unanswered conversations | New or active conversations with no qualifying brand response | Count of eligible threads without a reply | Identifies missed leads, support backlog, or staffing gaps |
| Automated replies | Messages sent by bots, rules, or automated flows | Count or percentage of automated messages | Evaluates automation coverage and workload reduction |
| Human replies | Messages sent by a person | Count or percentage of human replies | Measures personal assistance and escalation capacity |
One detail matters more than it may seem: track automated replies and human replies separately. A high reply rate can look good on paper. But if every reply came from automation, that doesn't mean people got what they needed.
Once the activity layer is in place, shift to what those conversations produced. This is where the inbox stops being just a support channel and starts showing business impact.
| Metric | Definition | Formula | Business use |
|---|---|---|---|
| Qualified conversations | Conversations meeting predefined fit and intent criteria | Count of threads marked qualified | Measures lead quality, not just attention |
| Follow-up completion rate | Share of eligible leads receiving the planned next follow-up | (Leads with completed follow-up ÷ leads requiring follow-up) × 100 | Reveals whether opportunities are being neglected |
| DM-to-booking rate | Share of qualified conversations resulting in a booked call | (Booked calls from DMs ÷ qualified DM conversations) × 100 | Compares campaigns by appointment generation |
| DM-to-sale rate | Share of conversations started that produce an attributable purchase | (Attributed sales ÷ conversations started) × 100 | Measures direct commercial effectiveness |
| Revenue per DM lead | Average attributed revenue per DM lead | Attributed revenue ÷ DM leads | Supports budget, staffing, and tool decisions |
Before you report on qualified conversations, define what qualified means. In most cases, that includes a relevant need, fit, budget, and a clear next step. If that line is fuzzy, the metric won't mean much.
A blended conversion rate across all DM sources usually tells you very little. Source-level data shows which content drives replies and which sources drive purchases.
| Source | Conversations started | Qualified conversations | Purchases | Attributed revenue | DM-to-sale rate | Revenue per DM lead |
|---|---|---|---|---|---|---|
| Reel A | 800 | 80 | 8 | $4,800.00 | 1.0% | $6.00 |
| Story B | 300 | 105 | 15 | $9,000.00 | 5.0% | $30.00 |
| Click-to-DM ad C | 500 | 150 | 20 | $12,000.00 | 4.0% | $24.00 |
That table makes the point fast. Reel A brings more volume, but Story B produces a much better DM-to-sale rate and far more revenue per DM lead. If you only looked at total conversations, you'd miss that.
Segment DM data by:
You can add geography or agent-level views later, but only after each segment has enough volume to make the comparison worth trusting. These metrics only help when your reporting setup can separate them cleanly.
Once your DM metrics are clear, the next step is figuring out which tool can report them the right way. Native Instagram tools are good at showing content performance. Meta adds inbox activity. And DM dashboards go further by tying conversations to business results.
Instagram Insights and the Professional Dashboard show reach, views, engagement, follower changes, audience demographics, and post-level performance for posts, Reels, and Stories. That makes them useful for spotting which content pushed people into your inbox.
That said, there’s a hard limit here. These native views were not made for conversation-level reporting. They won’t tell you who owned a conversation, how long it took someone to reply, or which chat led to a sale. Use them to answer what content is driving people into our inbox? - not what happened after they arrived?
One small but important note: Views counts repeat plays, so it should not be compared directly with older Impressions-based reports.
If you want inbox activity and reply tracking, you need to go one step deeper.
Meta Business Suite brings connected Facebook and Instagram assets into one desktop workspace. For DM reporting, the big additions are the Inbox and messaging metrics: accounts that sent a DM, new contacts, returning contacts, response rate, response time, and available lead or order outcomes.
Use Meta Business Suite to track inbox trends and Instagram analytics for reply metrics. If you need owner-level reporting or a clear line to revenue, you’ll need a DM dashboard on top of it.
For conversation ownership, SLA tracking, and revenue links, native Meta reporting won’t go far enough.
A DM-specific dashboard fills the gap left by native tools. The main things it should add are conversation ownership, tags and lead stages such as new inquiry, qualified, meeting booked, won, lost, or nurture, reply-time tracking against set service targets, and scheduled exports that feed a CRM or monthly report.
Here’s how the three layers stack up:
| Capability | Instagram Insights / Professional Dashboard | Meta Business Suite | DM-specific dashboard |
|---|---|---|---|
| Conversation detail | Account and content metrics only | Inbox access and messaging summaries | Conversation, message, tag, stage, source, and outcome detail |
| History | Varies by metric and date range; some views support recent preset periods or custom ranges up to 90 days | Date-filtered insights, subject to Meta's available data limits | Configurable history, subject to vendor and API limits |
| Team attribution | Not built for agent-level reporting | Shared inbox workflows, limited agent analytics | Owner, assignee, workload, and first-response time |
| Exports | Varies by view and account | May provide additional reporting and export options, depending on the view and account | Scheduled CSV, API, CRM sync |
| Automation metrics | Focused on account and media performance | Limited automation attribution | Bot starts, handoffs, flow completion, human-reply outcomes |
| Revenue attribution | No native DM-to-revenue view | Activity review only; needs external sales data | CRM-linked stages, opportunities, won revenue, attribution windows |
If your team can’t answer which conversations created qualified leads, who handled them, how fast, and which ones produced revenue with native tools alone, that’s the clearest sign you need another reporting layer.
Once you've locked in your metrics, the next step is simple: show how fast the team replies and who owns each conversation. That's what turns inbox activity into something you can manage, not just watch.
A solid DM reporting dashboard should track human reply performance apart from automation. Human messages, rule-based automation, AI-assisted replies, and system-generated messages should each be counted as separate message types. If you mix them together, automation can make team coverage look better than it is.
Use median first-response time as the main speed metric. A small batch of late replies can throw off the average, so median usually gives a cleaner read on day-to-day performance. If you can, report both median and average, and include the 90th percentile to show the slow tail.
| Metric | Definition | Calculation method | Reporting caution |
|---|---|---|---|
| First reply time | Time from first inbound message to first human reply | First human reply timestamp − first inbound message timestamp | Exclude automated acknowledgments and define whether business hours or calendar hours apply |
| Median response time | Middle response time after sorting all qualifying response times | 50th percentile of response times | More representative than an average when a few delayed replies distort results |
| Average response time | Mean time to respond | Total response time ÷ number of qualifying replies | Can be skewed by a small number of very late responses |
| 90th-percentile response time | Time within which 90% of conversations received a reply | 90th percentile of response times | Requires enough data volume and a documented percentile method |
| Unanswered rate | Share of qualifying inbound conversations without a human reply within the reporting window or service-level target | Unanswered qualifying conversations ÷ total qualifying inbound conversations × 100 | Specify the cutoff, such as "no human reply within 24 hours", and avoid treating spam or duplicate messages as normal inquiries |
| Handoff time | Time between the decision to transfer a conversation and acceptance or first action by the receiving teammate | Receiving teammate's acceptance or first-action timestamp − handoff timestamp | Define whether reassignment alone counts as handoff; it is usually better to require an acceptance or documented action |
| Human reply rate | Share of inbound conversations that received at least one human reply | Conversations with a qualifying human reply ÷ qualifying inbound conversations × 100 | Report separately from automated replies so automation does not conceal a lack of staff coverage |
| SLA attainment | Share of conversations answered within the team's target | Conversations answered within the stated target ÷ qualifying conversations × 100 | State the target, time zone, business-hours calendar, and exclusions in every recurring report |
Meta's 24-hour response window makes timestamps a MUST-HAVE field in reporting. For each reply, record whether it landed inside or outside that window, who sent it, and whether it was human or automated. If your account uses away periods, log those too. Messages that arrive while an account is marked away do not affect response-rate or response-time calculations.
Fast replies matter. But ownership tells you who actually moved the conversation.
Give each conversation one clear owner. That avoids false credit. Otherwise, reply counts can end up rewarding the teammate who happened to send the last message, even if someone else did most of the work.
Each conversation also needs a steady status structure, such as New, Open, Waiting for Customer, Waiting for Internal Response, Escalated, Resolved, or Closed. Add standardized tags for lead stage, source, and topic. Internal notes help teammates pass context during handoffs without sending that information to the customer.
A required closed reason turns a finished conversation into usable reporting data. That reason might be won, qualified but pending, no response, not a fit, support resolved, spam, or duplicate. Use status and closed-reason fields to follow each thread from first reply to final outcome.
It also helps to split workload metrics from outcome metrics. Replies sent, conversations handled, and notes added show activity. Qualified leads, booked calls, and revenue show business impact. High message volume doesn't always mean strong performance. Sometimes it means a teammate is buried in messy threads that should've been simpler.
Before you compare teammates, segment by conversation type and source. A sales rep working through detailed pricing questions shouldn't be judged by the same speed or volume standards as a support rep answering order-status messages. That's apples to oranges.
Once reply and ownership data are clean, exports make recurring reporting possible. But an export is only useful if it reproduces the same numbers month after month.
Every export should include the Instagram account name and ID, the reporting period with start and end dates, the export timestamp, the time zone and daylight-saving convention, all active filters, and plain metric definitions. Skip that context, and future reports start drifting.
| Export type | Best use | Granularity | Automation potential | Privacy considerations |
|---|---|---|---|---|
| CSV | Spreadsheet review, team scorecards, CRM uploads, and ad hoc analysis | Row-level or aggregated, depending on the export | Medium; easy to schedule or load into a data warehouse | Can expose message text and personal identifiers; restrict access and encrypt transfers |
| Executive or client reports with charts, commentary, and fixed layouts | Primarily aggregated | Low; suitable for distribution rather than machine processing | Redact sensitive details and control downloads because PDFs are easy to forward | |
| JSON | Raw or semi-structured application data, message events, and custom pipelines | Often conversation- or message-level | High for engineering workflows | Requires strict schema, access, retention, and logging controls |
| API or warehouse feed | Recurring dashboards, cross-channel analysis, CRM matching, and alerts | Flexible, from events to aggregates | Highest, subject to permissions, rate limits, and endpoint availability | Apply least-privilege access, token protection, encryption, deletion rules, and audit logging |
For recurring reports, use a stable filename like instagram_dm_2026-09_UTC.csv. Keep the raw export separate from any transformed version, and store metric definitions next to both. Don't assume old data will still be there later. Check each export against a manual sample so you can catch missing webhooks, pagination errors, duplicate message IDs, deleted conversations, or time-zone conversion mistakes before they pile up.
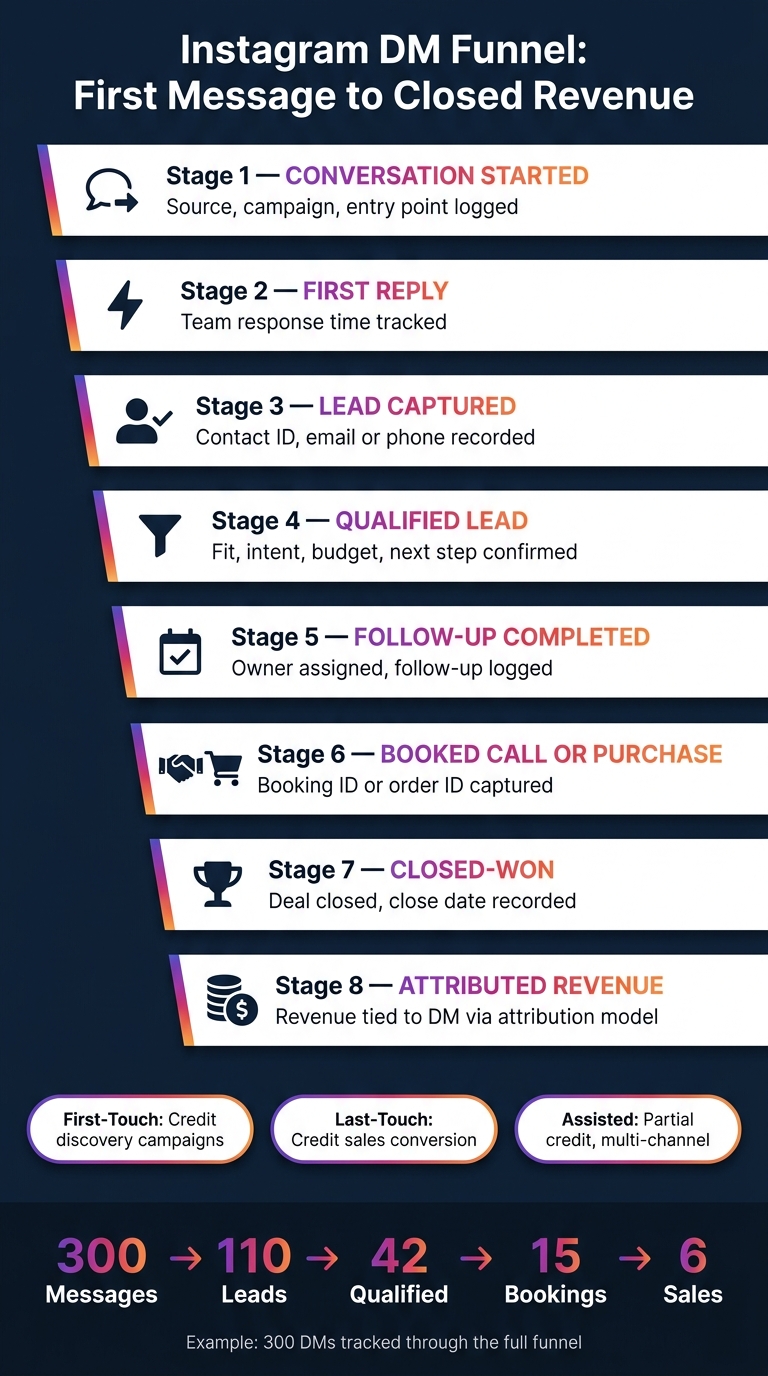
Instagram DM Funnel: From First Message to Closed Revenue
Once reply tracking, ownership, and exports are set up, map those fields into a funnel that follows each conversation all the way to revenue.
A DM funnel works best when every conversation moves through the same path: conversation started → first reply → lead captured → qualified lead → follow-up completed → booked call or purchase → closed-won or closed-lost. Each stage should use the same status label, timestamp, and owner field every time. That way, you can spot where contacts fall out of the funnel and what’s causing it.
Here’s the stage-by-stage map:
| Funnel stage | Required data fields | Business decision supported |
|---|---|---|
| Conversation started | Conversation ID, start timestamp, source, campaign | Which campaigns or entry points generate demand? |
| First reply | Conversation ID, inbound and outbound timestamps | Is the team responding reliably? |
| Lead captured | Contact ID, email or phone, capture timestamp | Are DMs producing identifiable prospects? |
| Qualified lead | Contact ID, qualification status, criteria, qualification timestamp | Which sources produce sales-ready prospects? |
| Follow-up completed | Owner, follow-up timestamp, follow-up status | Where are opportunities being neglected? |
| Booked call or purchase | Booking ID or order ID, conversion timestamp, outcome | Which offers and scripts drive action? |
| Closed-won | Deal or order ID, close date, revenue | What share of qualified leads became customers? |
| Attributed revenue | Revenue, currency, attribution model, deal ID | How much revenue can be credited to DMs? |
| Revenue per new conversation | Attributed revenue, new conversations | Is each conversation economically valuable? |
Attribution rules matter just as much as the funnel stages. First-touch attribution gives credit to the first recorded Instagram entry point that introduced the lead. That’s useful when you want to judge discovery campaigns. Last-touch attribution gives credit to the most recent tracked DM, link, code, or interaction before conversion. That’s a better fit for sales ops. Assisted attribution gives Instagram DM partial credit when another channel also helped close the deal.
Be clear in every report about which model you’re using. And don’t mix totals from different models unless they’re labeled separately. If you don’t do that, the numbers can look better - or worse - than they are.
To prove that a booking or purchase came from a DM, use more than one matching signal:
Then match contact details, order IDs, or booking IDs across your CRM, booking system, and ecommerce platform.
Once the funnel is set, use those same fields in a monthly report. That keeps every team looking at the same numbers instead of debating what the numbers mean.
Use one dataset, then show different views for marketing, sales, and support. The data stays the same. The columns change based on what each team needs.
Marketing should see source, campaign, entry point, qualified-lead rate, and first-touch attribution. Sales should see response time, owner-level response rate, follow-up completion, win rate, and last-touch revenue. Support should see unresolved conversations, resolution time, and recurring issue categories.
A practical monthly report for Mar. 1–31, 2026 should cover volume, response speed, lead capture, qualification, bookings, purchases, revenue, top sources, owner follow-up, unresolved conversations, and a short data-quality note.
The key step is linking conversation volume from Meta Business Suite to qualification, bookings, and revenue through CRM or DM dashboard records. That link is what turns the report from a pile of activity data into something a team can act on.
Reliable DM reporting comes down to four habits.
Use native Meta views and free Instagram tools together with a CRM or DM-specific dashboard. Also keep team activity metrics - replies sent, conversations handled - separate from business outcome metrics - qualified leads, bookings, and revenue.
Set up a clear attribution system that ties DM conversations to closed sales. First, define what counts as a lead and what counts as a sale. Then track each thread with UTM-tagged links, DM-only promo codes, and CRM fields.
Review Lead Rate, Sale Rate, revenue per DM, and ROI in one dashboard each week. That way, you can spot where deals fall off and tweak your scripts or targeting.
Focus on the metrics that connect inbox activity to business results: reply rate, lead rate, and sale rate.
These numbers show what happens at each step:
It also helps to track average order value, revenue per DM, and time-to-first-reply. When you review all of these in one dashboard, it’s much easier to spot where people drop off and see what needs work.
You need a CRM or DM dashboard when you sell higher-ticket offers or deal with longer sales cycles and link clicks or promo codes can't show the full path to a sale.
It ties each DM conversation to closed deals, so you can see lead status, revenue per DM, and sales rates in one place. That gives you a much clearer view for budget planning, team coverage, and campaign choices.


