
Average Likes Per Post on Instagram in 2026 (Benchmarks by Follower Count)
Instagram likes benchmarks for 2026 by follower tier — learn likes-to-follower ratio ranges to judge post performance.
Instagram likes benchmarks for 2026 by follower tier — learn likes-to-follower ratio ranges to judge post performance.
4.98 /5 - from 58k reviews
Trusted by 50,000+ creators — get real engagement delivered to your profile in minutes, not days.

A “good” Instagram like count in 2026 depends on follower count, not one flat average. If I want a fast benchmark, I look at the engagement rate: smaller accounts often land around 4%–6%, while accounts with 1 million+ followers often sit closer to 0.5%–2%.
Here’s the short version:
If I want to judge a post the right way, I compare it to the right follower tier first, then I check the ratio instead of staring at the like total by itself.
Quick Comparison
| Follower Tier | What usually looks normal |
|---|---|
| Nano (1K–10K) | Highest like rates, often around 4%–6% |
| Micro (10K–50K) | Lower than nano, with raw likes starting to matter less than ratio |
| Mid-Tier (50K–500K) | Ratios often sit near 1% on normal posts |
| Macro (500K–1M) | Raw likes can look big, but ratios are often much lower |
| Mega (1M+) | Often around 0.5%–2%, even on solid posts |
So before I call a post “good” or “bad,” I match it to account size, check the percentage, and use likes as one signal, not the whole scorecard.
A good like count depends on your follower tier. The best way to judge it is by your follower-to-following ratio, not by some platform-wide average. Start with account size, then see whether your likes land in the normal range.
The same like count can look strong on one account and weak on another. The table below shows like ranges by follower tier, plus a worked example using 500 likes so you can see how the same number changes based on account size.
| Follower Tier | Follower Range | Good Like Count Example | Worked Example: 500 Likes |
|---|---|---|---|
| Nano | 1K–10K | 200–350+ likes | Strong - 500 likes on a 5K account is 10%. |
| Micro | 10K–50K | 400–1,500+ likes | Below average - 500 likes on a 40K account is 1.25%. |
| Mid-Tier | 50K–500K | 1,200–7,500+ likes | Low - 500 likes on a 200K account is 0.25%. |
| Macro | 500K–1M | 7,500–15,000+ likes | Very low - 500 likes on a 700K account is 0.07%. |
| Mega | 1M+ | 10,000–25,000+ likes | Negligible - 500 likes on a 2M account is 0.02%. |
If raw likes still feel hard to size up, the ratio benchmark below is the cleaner test.
Read this as a tier benchmark, not a fixed target.
For nano accounts (1K–10K followers), like rates are usually highest. If a post gets 200–350+ likes, that’s a strong result for this tier.
For micro accounts (10K–50K followers), a solid range is 400–1,500+ likes per post. So yes, that same 500-like post can look fine on a small account but weak on a 40K profile.
For mid-tier accounts (50K–500K followers), ratios tend to drop as audience size grows. In this range, 1,200–7,500+ likes is a solid outcome.
For macro and mega accounts (500K–1M+ followers), the benchmark shifts a lot. At that size, 7,500–25,000+ likes is a more realistic range.
Format plays a part too. Carousels and Reels often do better than static images.
What looks normal changes with follower count. To get a cleaner read, compare likes to followers next.
There’s no single “normal” like count in 2026.
A post with 500 likes might be a great result for one account and a letdown for another. It all comes back to follower count, because that’s what sets the benchmark.
A platform-wide average mashes millions of very different accounts into one number. That makes it close to useless when you’re trying to judge your Instagram metrics.
Here’s why: a nano account with a tight, engaged niche audience will often beat a macro account with a broader, less active following. The macro account may pull in more raw likes, but that doesn’t always mean the post performed better.
Niche and format matter too. Accounts with engaged audiences, plus feeds built around carousels and Reels, tend to get more likes than broader accounts or feeds that lean on static photos.
The simplest way to do this is to start with your follower tier. Then look at your last 10 posts and calculate your baseline.
Once you have that number, compare it against the follower-tier table below.
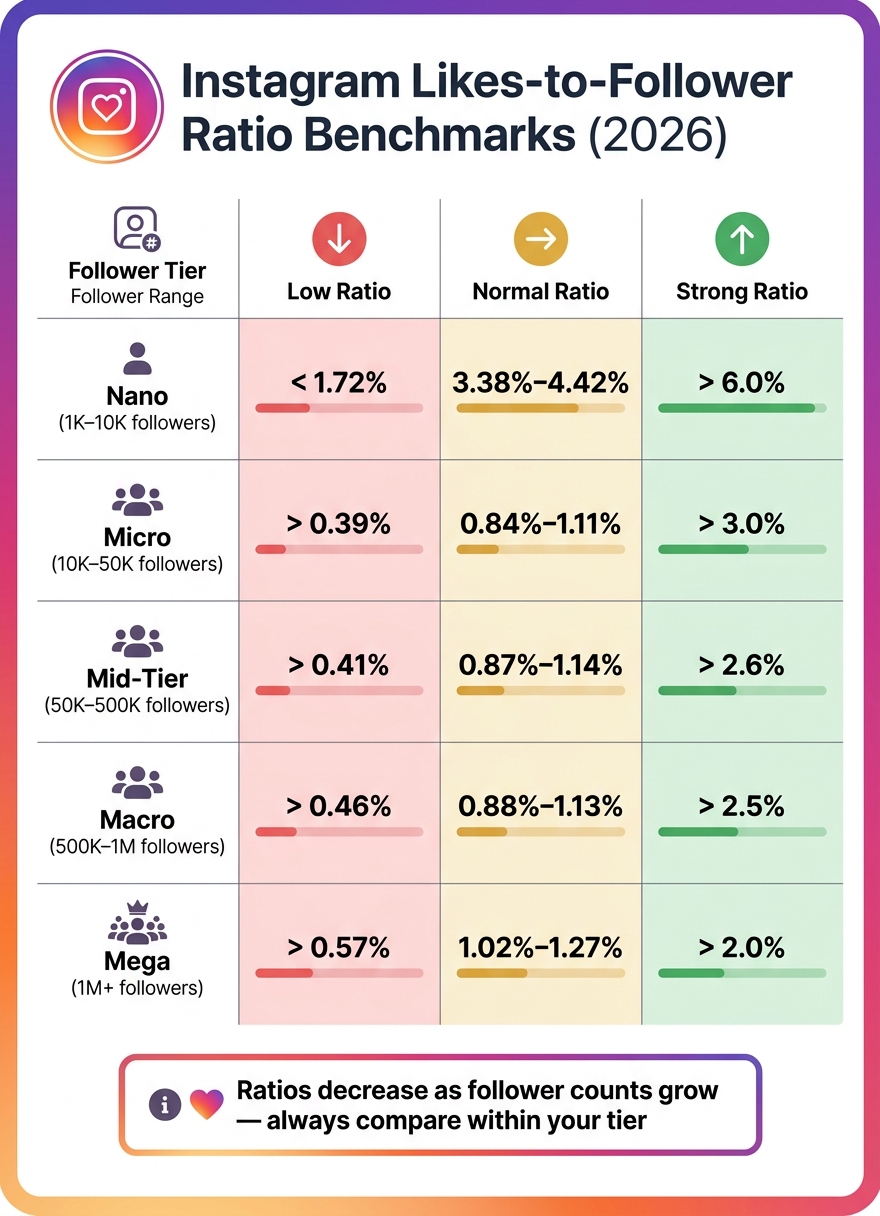
Instagram Average Likes Per Post by Follower Count (2026 Benchmarks)
The likes-to-follower ratio shows how much of your audience is taking action. You calculate it by dividing likes by followers, then multiplying by 100. It’s the fastest way to see if a post is performing at a normal level, doing better than usual, or falling flat for your follower count.
One thing trips people up all the time: the same number of likes can mean very different things depending on the size of the account. Smaller accounts often get higher percentages, while bigger accounts tend to see those percentages drop as they grow.
| Follower Tier | Low | Normal | Strong |
|---|---|---|---|
| Nano (1K–10K) | < 1.72% | 3.38%–4.42% | > 6.0% |
| Micro (10K–50K) | < 0.39% | 0.84%–1.11% | > 3.0% |
| Mid-Tier (50K–500K) | < 0.41% | 0.87%–1.14% | > 2.6% |
| Macro (500K–1M) | < 0.46% | 0.88%–1.13% | > 2.5% |
| Mega (1M+) | < 0.57% | 1.02%–1.27% | > 2.0% |
In plain English, follower quality changes the story. A like count that looks solid at first glance might be weak once you compare it to the size and health of the audience.
You can check your numbers with UpGrow's free Instagram likes-to-followers ratio calculator.
Ratios get smaller as accounts get bigger. So if you compare a Nano account to a celebrity-sized profile, you’re not comparing apples to apples.
If your ratio looks low, don’t panic. The next move is to see whether fake or inactive followers are pulling the number down.
If your ratio looks low compared with the table above, there are usually two reasons: audience quality and the way Instagram now weighs engagement.
If your likes seem lower in 2026, that's normal. Engagement is down, and likes don't carry as much weight as saves and shares.
Every inactive or fake follower adds to your follower total without ever tapping the heart button. That inflated denominator pulls your ratio down, on a pure math level, and can make normal content look like it's missing the mark.
A better ratio starts with a better audience. Remove inactive followers slowly, and put your energy into bringing in real people who actually engage. That's the main idea behind UpGrow's organic growth service: real followers who interact, not empty numbers.
Once your audience is cleaner, it helps to look at what likes are actually telling you.
Likes still matter, but they don't tell the whole story. In 2026, saves, shares, and DMs matter more because Instagram has moved more of its engagement toward private actions.
Think of likes as a quick health check. A strong like count shows that people are responding in the moment. But saves, shares, and DMs are better signs that your post has staying power and gives people a reason to come back to it or pass it along.
Use your Instagram engagement rate calculator to look at the full picture, not just likes by themselves.
If you want a better follower mix, use the ratio calculator above and focus on real followers.
If your like count still looks low, check the FAQ below for the fastest benchmark answers.
Share this post&description=Instagram%20likes%20benchmarks%20for%202026%20by%20follower%20tier%20%E2%80%94%20learn%20likes-to-follower%20ratio%20ranges%20to%20judge%20post%20performance.&image=https://www.upgrow.com/blog-images/assets.seobotai.com/cdn-cgi/image/quality=75,w=1536,h=1024/upgrow.com/6a4af1bb7b335034c3b6115d-1783300012639.jpg)


