
Highlight Navigation vs. Story Views
Use Stories for reach and Highlights for retention—combine views and navigation metrics to improve Instagram engagement.
Use Stories for reach and Highlights for retention—combine views and navigation metrics to improve Instagram engagement.
4.98 /5 - from 58k reviews
Trusted by 50,000+ creators — get real engagement delivered to your profile in minutes, not days.
Instagram Stories and Highlights serve different roles in your content strategy. Stories are temporary (24-hour lifespan) and focus on immediate reach and engagement. Highlights are curated, permanent collections of Stories designed for long-term profile exploration and retention.
Key differences:
Quick Tip: Use Stories to attract attention and Highlights to retain it. Combine both metrics to refine your strategy, improve engagement, and optimize your content flow.
| Feature | Story Views | Highlight Navigation |
|---|---|---|
| Purpose | Immediate reach and discovery | Long-term retention and exploration |
| Lifespan | 24 hours | Permanent (until deleted) |
| Audience | Active followers | New profile visitors |
| Behavior Tracked | Unique views, impressions | Taps forward, back, exits |
| Best Use | Flash sales, live updates | FAQs, testimonials, branding |
Both tools offer valuable insights, but their real power lies in using them together to understand your audience and improve content performance.
A Story view is counted every time a unique account watches your Story within a 24-hour period. It’s a simple way to measure reach - it tracks unique viewers, not the number of times your Story has been played. If you have a Business or Creator account, Instagram provides this data in real time.
Story views act as a top-of-the-funnel metric. They focus on how many people initially see your content, rather than what they do afterward. Since Stories are displayed prominently at the top of the Instagram feed, they’re one of the quickest ways to gauge how many followers are actively engaging with your content.
Instagram doesn’t just stop at basic view counts. It offers three key metrics to give you a deeper understanding of your Story’s performance:
| Metric | What It Measures | Why It Matters |
|---|---|---|
| Reach | The number of unique accounts that viewed your Story | Shows the actual size of your audience for that content |
| Impressions | Total views, including replays | Indicates how engaging your content is - if impressions exceed reach, it means people are rewatching |
| Completion Rate | The percentage of viewers who watched the entire Story | Highlights how engaging your content is overall |
One helpful tip is to compare impressions to reach. A higher number of impressions compared to reach suggests that viewers are rewatching your Story - a sign that it’s resonating with them.
"If total views are much higher than unique viewers, it means some people are watching your Story more than once. That's a strong signal that your content is catching attention." - Practina
On average, Stories under 15 seconds long achieve a 90% completion rate. This explains why short, impactful content tends to perform better. If you notice a drop-off in views during the first frame, it could mean your hook isn’t strong enough. A decline midway through might indicate that your Story is too lengthy or loses focus.
While Story views are great for measuring visibility, they don’t provide insights into actions like profile visits, screenshots, or navigation behavior. This makes it essential to use Highlight navigation metrics to gain a fuller picture of how viewers interact with your content. Up next, we’ll dive into how these metrics can help fill in the gaps.
While Story views show how many people catch your content in real time, Highlight navigation focuses on how users interact with content they actively choose to explore. It tracks every tap, swipe, and exit within a Highlight, offering insights into deliberate user behavior.
Think of Highlights as a mini-website tucked right below your bio. For new visitors, they’re often the first stop before scrolling down to posts. Because opening a Highlight is an intentional action, each navigation metric sheds light on what resonates and what doesn’t. These numbers reveal how users engage with curated content at their own pace.
Each interaction inside a Highlight tells a story about user engagement:
| Navigation Action | What It Means |
|---|---|
| Taps Forward | Indicates quick scanning; high numbers suggest viewers are skipping content |
| Taps Back | Signals rewatching or needing more time - an indicator of valuable content |
| Next Story Swipes | Shows when users leave the Highlight entirely; marks a drop-off point |
| Exit Story Taps | Reflects when users close the Story, possibly due to disengagement or interest in the bio link |
"A Back Tap happens when a viewer taps the left side of the screen to go back and rewatch a previous Story... that is a deliberate action." - Otto Team
Pay close attention to Taps Back. A spike here often means the content was either compelling enough to rewatch or required more time to process (like text-heavy slides). Use this as a signal to create more of what’s working.
Unlike Stories, which vanish after 24 hours, Highlights stick around on your profile indefinitely. That longevity makes them perfect for content that stays relevant over time, such as your brand story, service details, client testimonials, or FAQs.
"Highlights are primarily a profile optimization tool, not a reach tool." - HubSpot Instagram Marketing Data
A well-organized Highlight section can act as a roadmap for visitors: About → Services → Testimonials → FAQ → Call to Action. This structured flow helps guide new visitors at their own pace, offering a more intentional experience than catching a fleeting Story in their feed. Brands that maintain organized and regularly updated Highlights often see better profile-to-follow conversion rates.
One tip: keep each Highlight to 20–30 slides max. This helps maintain viewer interest and reduces the risk of drop-offs midway through.
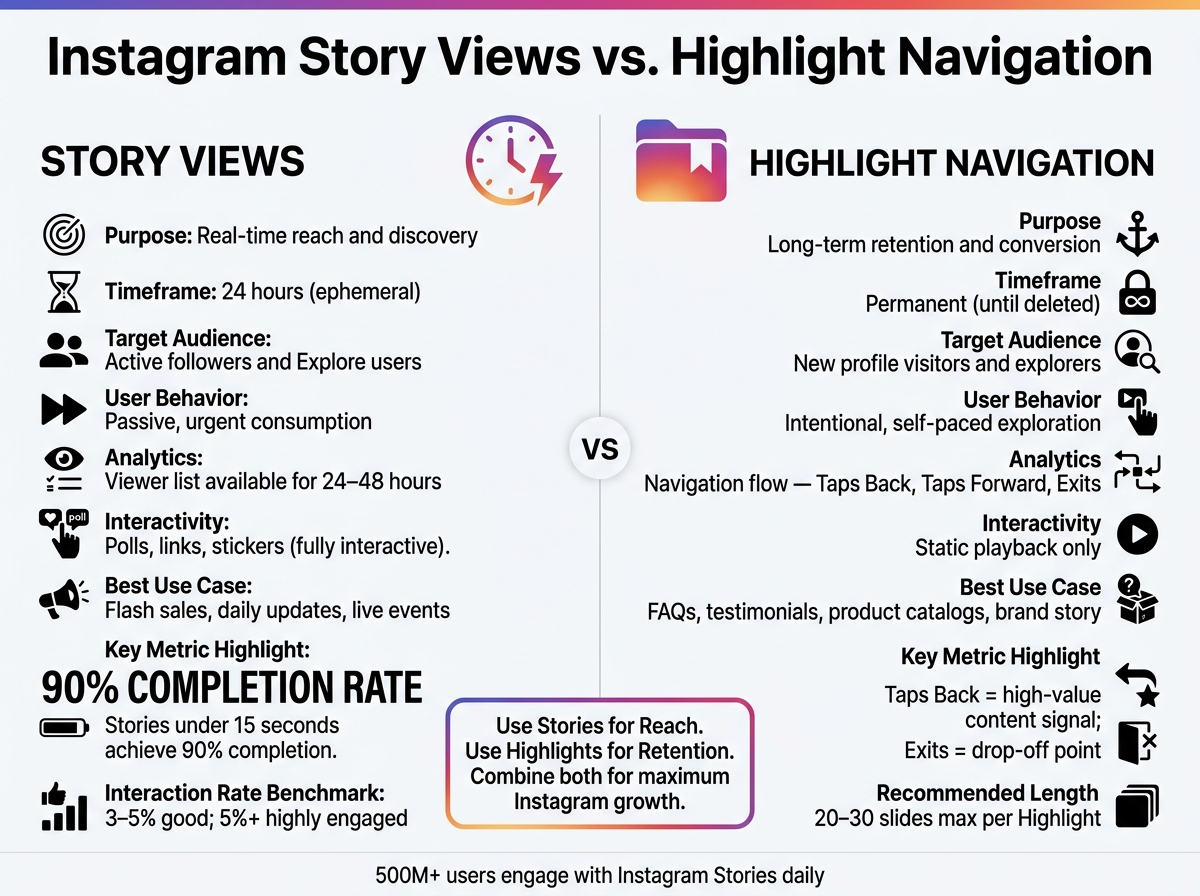
Instagram Story Views vs. Highlight Navigation: Key Differences
These two metrics serve entirely different functions. Story views measure how many people see your content, while Highlight navigation tracks what users do when they engage further. Essentially, one gauges reach, while the other reflects intent.
Stories, with their fleeting 24-hour lifespan, are all about driving immediate attention and creating a sense of urgency. On the other hand, Highlights cater to users who take the time to explore your profile deliberately.
This difference is crucial when analyzing your data. Story views give you a snapshot of your content's visibility and discovery potential. Meanwhile, Highlight navigation provides a deeper look at how users interact with your content flow and how engaging it is. As one source explains:
"Use Stories for reach; use Highlights for retention." - Admin, TheAnonyViewer
Keep in mind that while Stories offer a detailed viewer list for 24 hours, that data disappears permanently 48 hours after the Story is posted - even if it’s saved as a Highlight. This makes it essential to know when to focus on each metric.
Knowing the difference between these metrics helps you use them effectively. Story views are ideal for campaigns with a time-sensitive focus, like flash sales, product launches, or live events. They provide quick feedback through interactive tools like polls and questions or link clicks.
On the flip side, Highlight navigation is better for understanding how new visitors engage with your profile's long-term content. For instance, if a slide in your Highlight has a high exit rate, it might signal a weak point in your sequence. On the other hand, if users frequently tap back, it suggests that particular content resonates and deserves more emphasis.
"Navigation metrics show you what's working and what isn't. If a lot of viewers exit or skip to the next story, it's a not-so-great sign that your content isn't capturing attention." - Stacey McLachlan, Hootsuite
| Feature | Story Views | Highlight Navigation |
|---|---|---|
| Purpose | Real-time reach and discovery | Long-term retention and conversion |
| Timeframe | 24 hours (ephemeral) | Permanent (until deleted) |
| Target Audience | Active followers and Explore users | New profile visitors and explorers |
| User Behavior | Passive, urgent consumption | Intentional, self-paced exploration |
| Analytics | Viewer list for 24–48 hours | Navigation flow (Back/Forward/Exits) |
| Interactivity | Fully functional (polls, links, stickers) | Static playback only |
| Best Use Case | Flash sales, daily updates, live events | FAQs, testimonials, product catalogs |
Story views and Highlight navigation each provide valuable insights, but combining them gives you a fuller understanding of your audience's behavior. Views tell you who showed up, while navigation data shows how they interacted with your content. Together, these metrics help you separate passive scrollers from truly engaged viewers, offering a balance between immediate performance data and deeper engagement insights.
Story views offer more than just vanity metrics - they provide instant feedback that can shape your content strategy. Beyond the number of views, focus on essential Instagram metrics like completion rates and reply counts. These indicators reveal how well your content resonates. For instance, a solid interaction rate for Stories usually falls between 3% and 5%, while anything above 5% signals a highly engaged audience.
Timing also plays a crucial role. Studies suggest that posting Stories on weekday mornings (7–8 a.m.) or during weekends can maximize reach. If your first slide consistently loses viewers, consider experimenting with A/B testing. Try using a bold visual on one version and a teaser headline on another to see which grabs attention better. These real-time insights help you fine-tune your content approach quickly.
When you notice a Story slide getting a lot of repeat views, it’s a clear sign to save it to a permanent Highlight category. Once it’s part of a Highlight, use navigation data to optimize its position. For example, move the slides that receive the most "Back" taps to the beginning of the Highlight. This ensures new profile visitors encounter your most compelling content first.
It’s also important to adjust the sequence length based on audience behavior. If you notice "Next Story Swipes" spike around slide four or five, consider shortening future sequences to align better with viewer preferences. For slides with high exit rates, try adding a soft call-to-action, like "DM me before you go", to re-engage viewers and potentially recover leads. By tracking and tweaking navigation patterns, you can transform Highlights into a retention tool rather than just a static archive.
"The goal of any great digital storyteller is to minimize the 'Exits' and maximize the 'Back' taps." - Build My Plays
Once you've identified key Stories and Highlights, keeping tabs on their performance is essential. UpGrow simplifies this by offering real-time, centralized analytics that make tracking effortless.
UpGrow is an Instagram growth platform powered by AI, designed to help you monitor and optimize your content's performance. Its live dashboard tracks over 50 metrics in real time, giving you a clear picture of how your Stories and Highlights are doing. This includes insights into follower growth, engagement rates, and overall performance.
What sets UpGrow apart is its Smart AI Targeting feature. This tool allows you to filter your audience based on criteria like location, age, gender, language, and interests. The result? A more engaged audience that aligns with your content and goals.
Beyond analytics, UpGrow's AI agents take things further by analyzing Story views, reach, and interactions. They flag standout content and identify high-intent leads, making it easier to focus your outreach efforts. The platform’s automated tracking can save you 6–7 hours each week by turning Story views and Highlight navigation data into actionable insights.
To keep you on top of trends, UpGrow provides weekly reports that summarize performance across Stories and Highlights. Plans start at $39 per month, with a free option available for those just getting started.
As we've covered, combining real-time Story views with long-term Highlight navigation can be a game-changer for Instagram growth. These two metrics offer different but complementary insights: Story views reflect your immediate reach, while Highlight navigation sheds light on how users interact with and move through your content.
"The smartest Instagram strategy uses both formats in tandem... Stories for reach and real-time engagement, Highlights for branding and long-term visibility." – The AnonyViewer
To make the most of these tools, use Story view data to quickly identify which content resonates with your audience. Then, analyze navigation signals - like Back Taps, Forward Taps, and Exit rates - to decide which Stories deserve a spot in your Highlights. This approach ensures your Highlights stay focused, engaging, and helpful to new visitors, increasing the likelihood they'll follow your profile.
With over 500 million users engaging with Instagram Stories daily, standing out is no small task. This intense competition makes it essential to track and act on every engagement metric available. Platforms like UpGrow can help by pulling all your performance data into one live dashboard, so you always know what’s working and where to focus next.
When it comes to growing your audience, Story navigation metrics are far more insightful than simple view counts. While views only tell you how many people saw your content, navigation metrics - such as taps back, forward taps, and exits - reveal how your audience interacts with your Stories. These behaviors provide real-time feedback on the quality of your content and whether it’s holding viewers' attention.
Why does this matter? Because these signals directly influence how algorithms decide to promote your content. The more engaging your Stories, the better your chances of reaching new audiences. On the other hand, Highlights - since they’re passive archives - don’t generate this type of engagement data, making them less impactful for growth.
If you want to retain viewers and grow your reach, focus on improving your Story navigation metrics. Tools like UpGrow’s AI-powered analytics can help you analyze performance and turn those insights into strategies for gaining real followers.
Use Highlights to preserve evergreen content - the kind of information that stays relevant over time, like product details, FAQs, or key brand insights. Focus on Stories that have performed well, especially those with strong engagement metrics such as high views, replies, or interactions with stickers.
To make it easier for followers to connect with your brand, organize these Highlights into clear, logical categories. This structure helps guide them through your content and ensures they can quickly find what they’re looking for.
Avoid including random, situational, or overly personal Stories in your Highlights. Think of them as a carefully curated portfolio that represents the best of your brand.
High numbers of Forward taps or Exits in a Highlight can signal that the content isn’t keeping viewers engaged. Forward taps often mean the hooks aren’t compelling enough, or the frames lack value. On the other hand, spikes in exits may suggest issues with pacing or relevance. To improve engagement, consider trimming sections where exits are high or incorporating interactive elements to draw viewers back in. Tools like UpGrow can assist in refining your profile to turn these viewers into followers.


