
Ultimate Guide to Instagram Real-Time Analytics
Learn which real-time Instagram metrics to track, how to set up Insights and dashboards, and quick actions to boost engagement.
Learn which real-time Instagram metrics to track, how to set up Insights and dashboards, and quick actions to boost engagement.
4.98 /5 - from 58k reviews
Trusted by 50,000+ creators — get real engagement delivered to your profile in minutes, not days.

Real-time Instagram analytics let you make decisions based on live data instead of outdated metrics. This approach helps you adjust content strategies while posts are still active, maximizing engagement and growth opportunities. Key Instagram metrics include engagement velocity, saves, shares, and profile actions like website clicks or DMs. Tools like Instagram Insights or third-party platforms can track these metrics effectively.
Real-time analytics are essential for staying agile and optimizing Instagram strategies as trends evolve. By acting quickly, you can improve engagement, lower costs, and achieve better results.
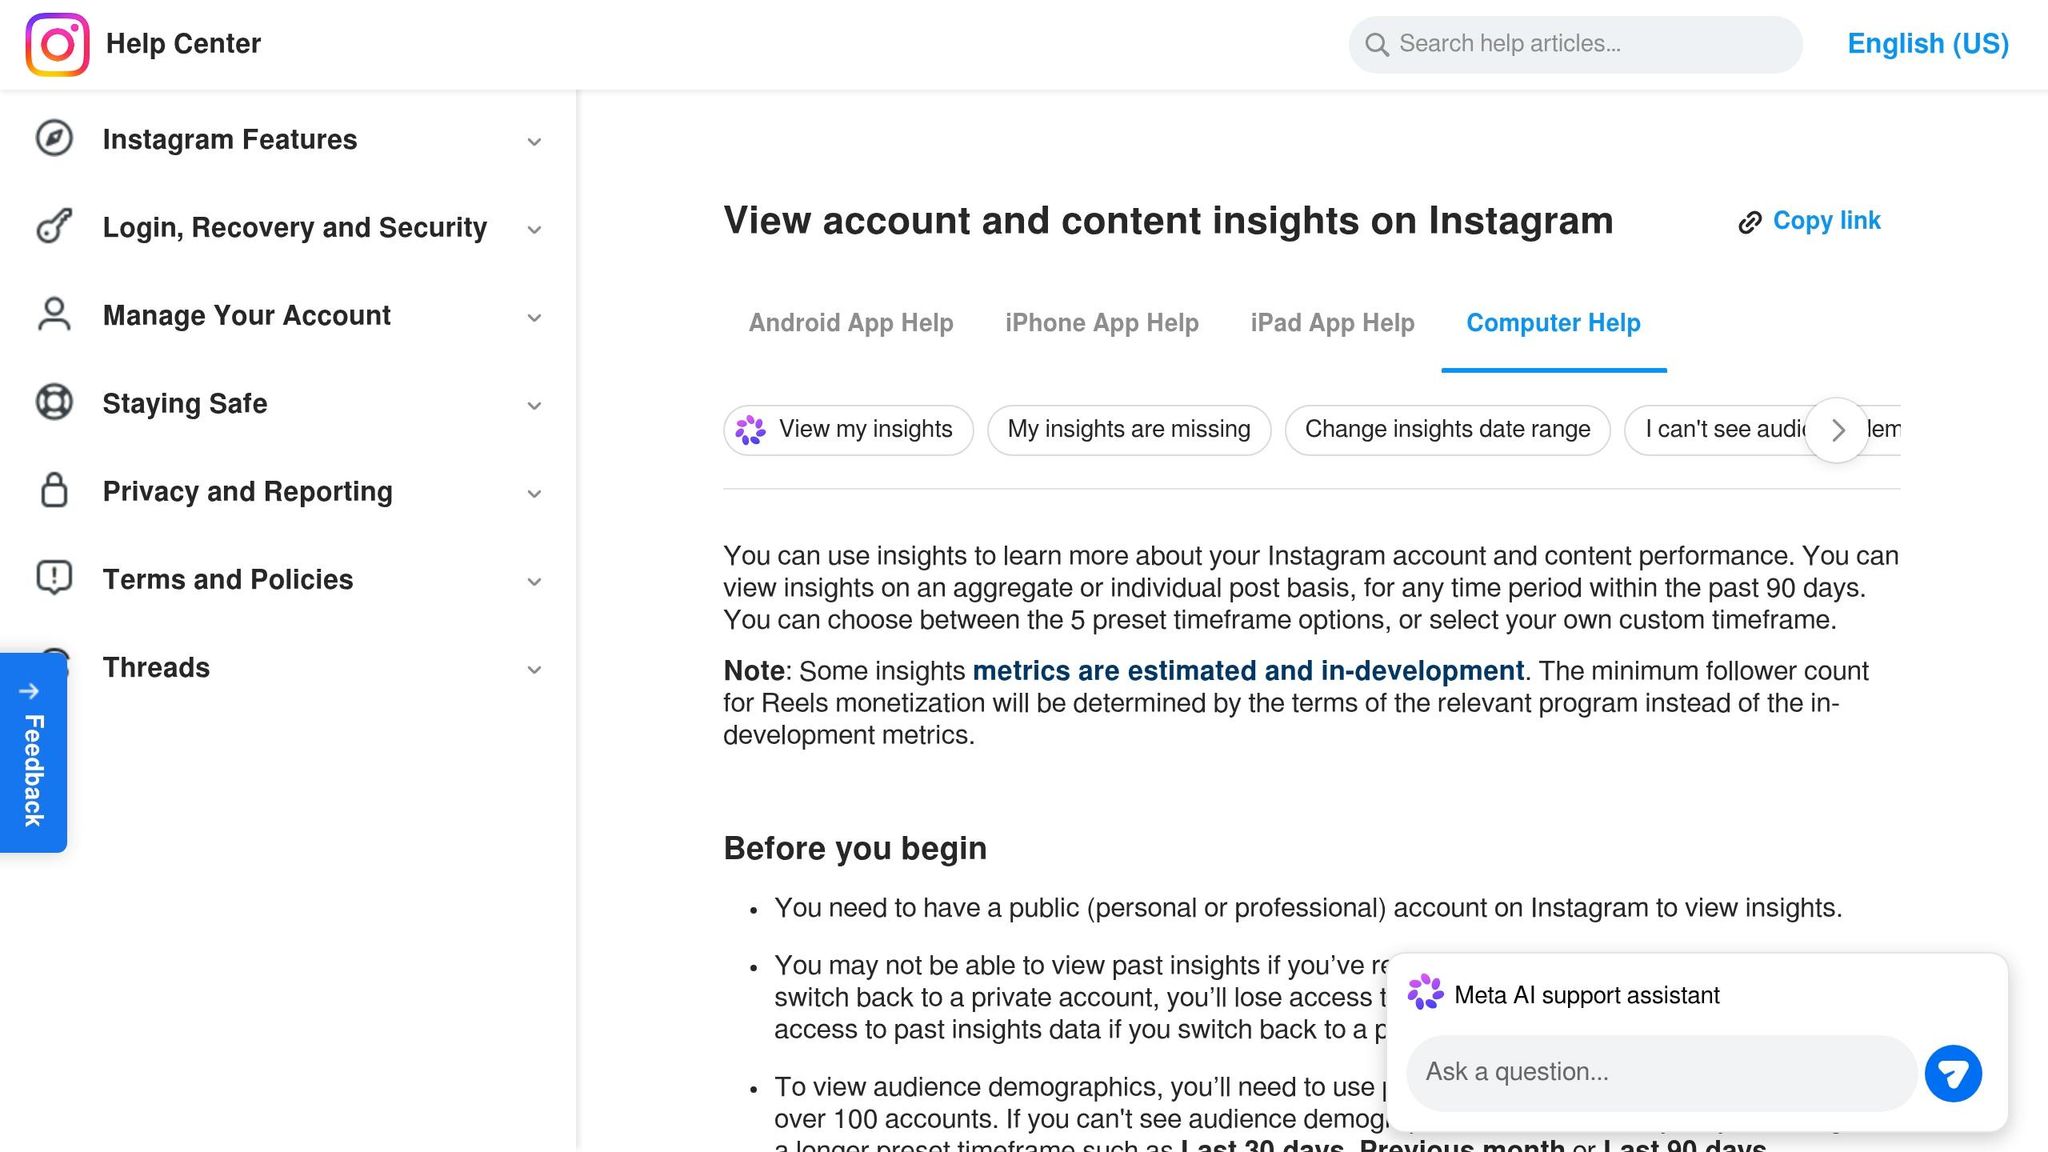
To access Instagram Insights, you need either a Business or Creator account. Switching is straightforward: head to Settings → Account type and tools → Switch to professional account. The process takes less than two minutes, but you’ll need to wait 24–48 hours for the dashboard to start displaying data. Once ready, you can access Insights through the "Professional Dashboard" on your profile or via the app's hamburger menu.
Creator accounts are designed for influencers and content creators, offering features like audience insights and content tools. Business accounts, on the other hand, provide more advanced reporting, product tagging, and advertising options.
Once your account is set up, you can use Instagram’s native Insights to monitor live metrics. The dashboard is divided into three sections: Overview (account-level metrics), Content (post performance), and Total Followers (audience demographics). To make tracking easier, pin your most important KPIs directly to the Professional Dashboard.
For Stories, swipe up on active Stories to see real-time data, such as views, exits, and taps, before the content is archived. Keep in mind that native Insights only store account-level data for 90 days. Because of this limitation, 73% of brands use third-party analytics tools to track long-term trends. For extended data analysis, consider maintaining a weekly spreadsheet to log metrics like reach, engagement rate, profile visits, top-performing posts, and website clicks.
"You cannot improve what you don't measure. Instagram Insights provides the measurements for free." - Michael Anderson, Instagram Analytics Specialist
While Instagram’s native dashboard provides a good starting point, a custom dashboard offers more precision for real-time tracking. Using Meta's Graph API, you can pull raw data and visualize it with tools like Looker Studio or Tableau.
Here’s a simple three-step process to build your own dashboard:
instagram_business_manage_insights permission to pull data.When designing your dashboard, group widgets based on three primary goals:
Focus on metrics that influence Instagram’s algorithm. For example, prioritize saves and shares over likes. Additionally, include a widget for Reel completion rates - while 50% is average, achieving a 75% completion rate or higher can boost reach by up to 5×. Custom dashboards built with third-party tools also bypass the 90-day data limit and allow for cross-platform reporting.
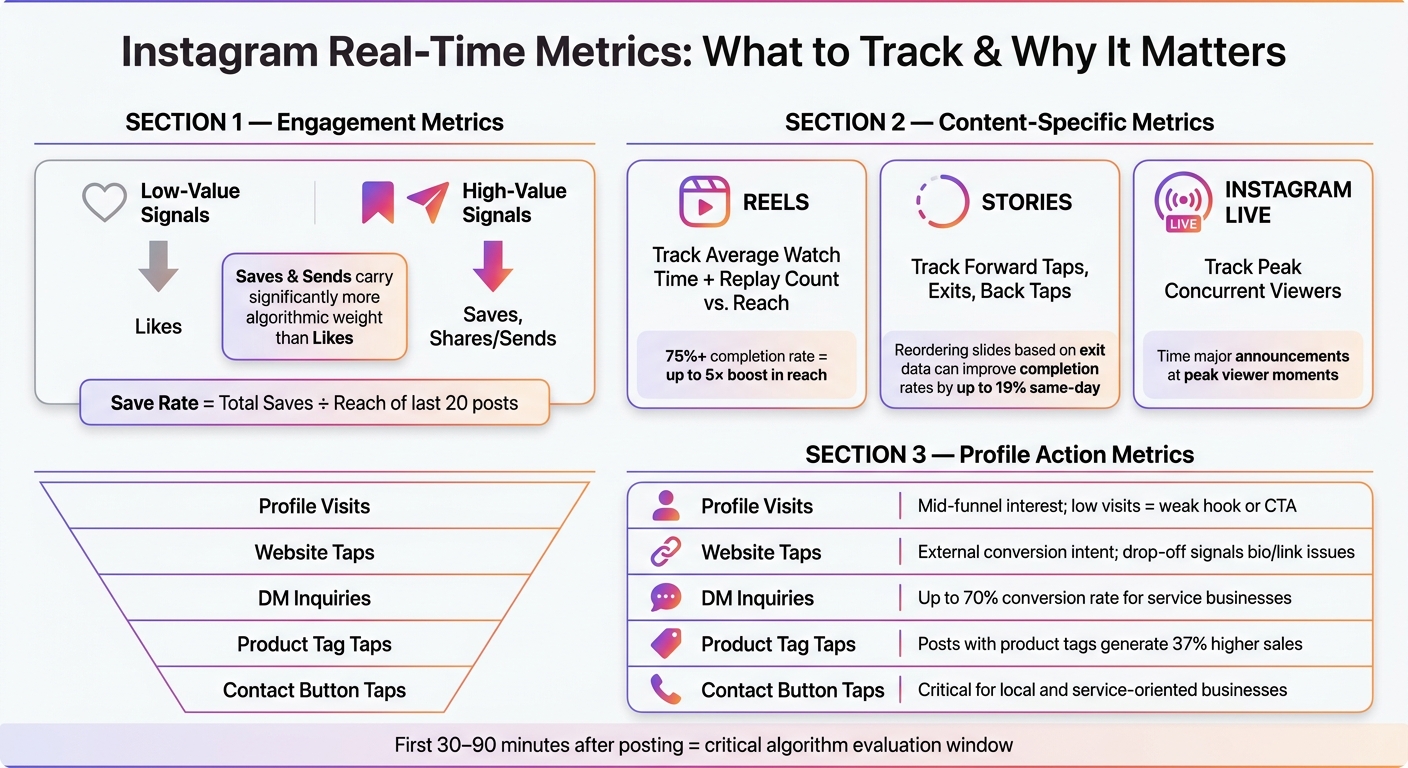
Instagram Real-Time Metrics: What to Track & Why It Matters
On Instagram, saves and sends carry much more weight than likes when it comes to the algorithm. A save tells Instagram that your content is worth revisiting, boosting its visibility. Meanwhile, a send - now referred to as a private share to someone’s DMs - signals a strong personal connection and relevance.
"A private share indicates a personal endorsement and high relevance, which Instagram prioritizes heavily over public likes." - Sprout Social
To gauge your performance, calculate your save rate by dividing the number of saves by the total reach of your last 20 posts. This gives you a meaningful benchmark to track progress, rather than focusing solely on like counts.
Different types of content, however, require their own tailored metrics to measure success effectively.
Each Instagram format has unique signals that matter beyond simple engagement numbers.
For Reels, prioritize average watch time over completion rates. With videos now stretching up to 20 minutes, the time someone spends watching is a stronger indicator of interest than whether they finish the video. Another key metric is the Replay count relative to reach. A high replay rate suggests the content is engaging enough to loop, potentially earning a spot on the Explore page.
For Stories, you’ll want to pay attention to Forward Taps and Exits. These metrics pinpoint exactly where viewers lose interest. By reordering or adjusting Story slides based on real-time exit data, you can improve completion rates by up to 19% in the same day. On the flip side, Back Taps show which slides resonate with viewers and are worth rewatching.
During Instagram Lives, tracking Peak Concurrent Viewers is crucial. This metric highlights the moment when your audience is at its largest, making it the best time for major announcements or calls-to-action.
These metrics go beyond post engagement, revealing how interactions translate into potential conversions. They provide insight into what happens after someone engages with your content, offering clues about their intent.
Profile Visits signal mid-funnel interest. If your content reaches a lot of people but doesn’t lead to profile visits, it might be entertaining but isn’t sparking curiosity about your brand. In such cases, review your hook, captions, or calls-to-action to close the gap. Website Taps, on the other hand, are a key indicator of external conversion intent. If there’s a significant drop-off between profile visits and website taps, it could point to issues with your bio or link offer.
For service-based businesses, DMs are a powerful metric. Engaging with local customers through Instagram Direct Messages can lead to conversion rates as high as 70%. Treat DMs as a lead-generation tool, not just a casual interaction. For e-commerce accounts, product tag interactions are equally telling - posts with product tags generate 37% higher sales on average than posts without them.
| Profile Action Metric | Metric Description | Why It Matters |
|---|---|---|
| Profile Visits | Number of users who clicked on your profile | Shows how well your content sparks brand curiosity |
| Website Taps | Clicks on your bio link | Indicates strong conversion intent for external traffic |
| DM Inquiries | Direct messages from viewers | A key lead-generation metric for service-based businesses |
| Product Tag Taps | Interactions with tagged products | Directly tied to e-commerce sales potential |
| Contact Button Taps | Calls, emails, texts, or direction requests | Vital for local and service-oriented businesses |
The first 30–90 minutes after posting on Instagram are crucial. During this window, the platform's algorithm evaluates engagement velocity - how quickly your post collects likes, comments, and shares - to determine its reach. If you miss this window, your content's visibility could take a hit.
To make the most of this period, take immediate action. If your post gains traction early, pin it to your profile or share it to your Stories to keep the momentum going. Noticing high engagement from non-followers? Consider boosting the post to a lookalike audience right away to expand its reach.
Real-time data isn't just about measuring performance; it's a tool for actively enhancing your strategies to increase engagement as they unfold.
Real-time insights are invaluable for making on-the-spot adjustments to your content. For example, in January 2026, a SaaS brand monitored Story insights during a feature launch. They noticed viewers were dropping off during technical slides but staying engaged with benefit-focused ones. By reordering the sequence to highlight benefits first, they increased completion rates by 19% - all within the same day.
This approach works for other formats too. If a Reel starts receiving a high number of saves and shares within the first hour, pin it to your profile and consider repurposing it as a paid ad while engagement is still strong. For Instagram Lives, keep an eye on peak viewer numbers to time your biggest announcements or calls-to-action for maximum impact.
These quick adjustments not only improve performance but also set the stage for smarter testing and optimization.
Real-time analytics are perfect for quick and effective A/B testing. Post two similar pieces of content with slight differences - such as captions, hooks, or visuals - and monitor metrics like link clicks, saves, and engagement velocity during the first few hours. This helps you identify which version resonates better.
For instance, in a January 2026 ad test, one video creative delivered a 42% lower cost-per-click (CPC). Acting on this insight, the team shifted 70% of the budget to the better-performing creative, cutting overall acquisition costs by 28%. These kinds of rapid adjustments are nearly impossible with delayed reporting.
| Real-Time Signal | Immediate Action | Expected Outcome |
|---|---|---|
| High engagement velocity | Pin post or share to Stories | Boost algorithmic reach |
| High Story exit rate | Reorder slides, lead with benefits | Increase completion rate |
| High save rate on a Reel | Repurpose into a paid ad | Lower acquisition costs |
| Low CPC on one ad creative | Shift budget to winning creative | Reduce overall acquisition cost |
Not all analytics tools are created equal, and one of the key differences lies in how quickly they update data. For real-time insights, you need a tool that refreshes data within minutes, especially during high-activity periods. But speed alone isn’t enough. A great tool should go beyond surface-level metrics like likes and follower counts. It should track deeper insights, such as Story completion rates, Reel watch time, link clicks, and profile actions that directly impact revenue. Customizable dashboards are a must, allowing you to focus on the KPIs that align with your business goals.
If you’re running paid campaigns, look for a tool that integrates seamlessly with platforms like Google Analytics or your CRM. This way, you can measure Instagram’s impact on website sessions, conversions, and revenue in USD. Precision like this is what makes tools such as UpGrow stand out.
UpGrow offers a powerful combination of a live analytics dashboard and AI-driven tools to improve your Instagram performance in real time.
The live dashboard provides 24/7 access to key metrics like follower growth, engagement, and content performance. For example, if one of your Reels surpasses your usual engagement by 30% within a few hours, you’ll know right away. This enables you to act fast - whether that’s pinning the Reel, sharing it to Stories, or reallocating ad spend to maximize its reach. UpGrow’s AI-targeting features also let you refine your audience by location, age, gender, language, and interests, constantly monitoring their responses to optimize your campaigns.
One standout feature is the Boost™ tool, which identifies high-performing content early and ramps up efforts to amplify its reach. During beta testing, users reported monthly follower growth increasing by as much as 275% with Boost™. For agencies, UpGrow simplifies campaign management with tools like multi-account handling, exportable PDF reports, and bulk discounts, making it easier to showcase real-time results during client reviews.
Since its launch in 2016, UpGrow has been trusted by over 100,000 Instagram users and maintains an impressive 4.98/5 rating from more than 58,000 reviews. Users often praise its organic, bot-free growth. Plans start at $39 per month and come with a growth guarantee - if your account doesn’t grow, you get your money back. These real-time insights can directly fuel your business strategies.
Real-time analytics are most useful when they’re tied to measurable business outcomes. The real value of Instagram data lies in how it connects to key results like traffic, leads, and revenue. One effective way to achieve this is by using UTM parameters on links in your bio, Stories, and posts. With these in place, Google Analytics (GA4) can trace website sessions, conversions, and purchases back to specific Instagram content. This allows you to build a conversion funnel that tracks user behavior - from impressions and profile visits to clicks, sessions, and eventual purchases or form submissions. By identifying where users drop off, you can fine-tune your strategy for better results.
Make sure your reports follow U.S. standards, using USD for currency, the MM/DD/YYYY date format, and standard number formatting. Keeping an eye on metrics like cost per lead (CPL) and return on ad spend (ROAS) in real time enables you to quickly pause campaigns that aren’t performing or scale up those that are delivering strong results.
Real-time Instagram analytics can be the difference between a thriving account and one that plateaus. The takeaway here is clear: act on fresh data. If you wait for weekly reports, you risk missing the critical moment when a Reel or Story is gaining traction and could go further with the right push.
The most important real-time metrics include engagement (likes, comments, saves, shares), reach, watch time, completion rate, and profile actions like website clicks and follows. By monitoring these metrics - daily for active posts and within the first few hours for high-priority content - you can quickly understand what resonates with your audience. Combine this with a structured weekly review, and you’ll start to notice patterns that simplify future content planning.
These strategies lay the groundwork for consistent growth and smarter decisions.
Keep your tools accurate. Double-check that Instagram Insights and any Instagram analytics tools are set up correctly, including the right U.S. time zone (ET, CT, MT, or PT) and active UTM parameters for tracked links. Misaligned settings can lead to flawed data, and flawed data leads to poor decisions.
Track your findings. Use a simple spreadsheet to log details like the date (MM/DD/YYYY), content type, hook, and key metrics at 1, 24, and 72 hours. This makes it easier to identify trends and refine your strategy over time.
For a more streamlined approach, consider tools like UpGrow. With live dashboards and AI-powered targeting, they can highlight your best-performing content, flag what’s underperforming, and help you make data-driven decisions in real time. Remember, acting on live data is what keeps your strategy agile and effective.
Real-time analytics give you instant updates on how your Instagram content is performing as it happens. This means you can track engagement, reach, and follower trends without waiting for delayed reports. While Instagram Insights updates less often, real-time tracking ensures you get immediate feedback on posts, Stories, and Reels. Tools like UpGrow provide live dashboards with hourly updates, allowing you to adjust your content strategy while your campaigns are still running.
To speed up your growth on Instagram, pay attention to these three important metrics:
By keeping tabs on these metrics, you can adjust your strategy and grow more effectively.
To connect Instagram activity to leads or sales, make sure you're operating with a Business or Creator account. This gives you access to Instagram Insights, where you can track essential metrics like:
By analyzing these insights, you can spot top-performing posts and tweak your strategies on the fly. Tools like UpGrow can further simplify this process by offering a live dashboard and detailed analytics, helping you refine your approach for better conversions.


