Top Metrics to Track in Instagram Growth Reports
Track reach, views, saves, shares, follower growth and profile CTR across Reels, Stories and carousels to turn Instagram data into smarter growth decisions.
Track reach, views, saves, shares, follower growth and profile CTR across Reels, Stories and carousels to turn Instagram data into smarter growth decisions.
4.98 /5 - from 58k reviews
Trusted by 50,000+ creators — get real engagement delivered to your profile in minutes, not days.
When it comes to growing on Instagram, tracking the right metrics is non-negotiable. Instagram's algorithm now prioritizes deeper interactions like saves and shares over likes, making it essential to monitor these metrics to refine your strategy. Here's what you need to know:
The key is to use data to make informed decisions. Tools like Instagram Insights and third-party analytics platforms can help you track these metrics and adjust your strategy for better results.
In 2026, Instagram made Views the standard metric across all content formats - Reels, posts, Stories, and Live videos. This metric reflects the total number of times your content is played or displayed, including repeat views from the same user. On the other hand, Reach measures unique accounts, counting each person only once, no matter how many times they view your content. Meanwhile, Impressions are now primarily used within Meta Ads Manager to evaluate paid campaigns.
"Views: The number of times your content was played or displayed." – Instagram Help Center
If your Views significantly outpace your Reach, it indicates that users are watching your content multiple times, suggesting strong engagement and broader distribution. For Reels, every single play counts as a view, making it a dependable way to gauge how far your content travels. Understanding these metrics can simplify automated growth reports and help pinpoint what drives algorithmic success.
Next, let’s explore how differentiating between follower and non-follower reach can fine-tune your growth strategy.
Breaking down your reach by audience type helps you see whether you're engaging new viewers or primarily connecting with your existing followers. Follower Reach reflects how well you’re engaging your current audience, while Non-Follower Reach reveals how effectively your content is being discovered through features like the Explore page, Reels tab, or hashtags.
Balancing both types of reach is key for growth. For example, feed posts often reach 15–30% of followers, Stories reach about 5–15%, and Reels can sometimes exceed 100%. If your Follower Reach is high but Non-Follower Reach is lagging, it could mean your content isn’t reaching new audiences. To improve discovery, consider refining your hashtag strategy, using trending audio, and making the first few seconds of your videos attention-grabbing to boost your "View Rate".
Instagram Insights now offers the ability to filter both Views and Reach by followers versus non-followers, giving you a detailed look at how much of your audience is new. This breakdown is invaluable for assessing whether your efforts are effectively expanding your reach beyond your existing community.
Engagement metrics help transform audience interactions into insights that can guide your growth strategies. In automated growth reports, these metrics play a critical role in adjusting strategies on the fly. While likes are the simplest form of approval, they carry less influence in Instagram's algorithm compared to more meaningful interactions. For example, comments are weighted three times more than likes, as they indicate a deeper level of interest. To encourage comments, try asking engaging questions or sharing thought-provoking insights - this can significantly boost your content's visibility.
Saves are another key metric, as they show that users find your content worth revisiting. The algorithm considers saves a strong quality signal. Similarly, sends - which track private sharing - are a powerful indicator of viral potential. When users share your content privately, it signals to the algorithm that your post is resonating on a deeper level.
Timing also matters. Responding to early comments can increase your post's distribution by up to 25%. A good approach is to reply to the first 10 comments within 30 minutes of posting. Additionally, posts with a high number of saves relative to likes tend to outperform others because the algorithm prioritizes content that provides ongoing value.
Understanding these core interactions is essential before diving into how engagement rates are calculated and benchmarked.
Engagement rate (ER) is calculated by dividing total interactions (likes, comments, shares, saves) by either total followers or reach, then multiplying by 100. As of 2026, the average Instagram engagement rate across all account types is 1.2%. However, these benchmarks can vary greatly depending on account size and content type.
Here’s a quick look at 2026 engagement benchmarks by content type:
| Content Type | 2026 Engagement Rate Benchmark |
|---|---|
| Static Image | 0.8% – 1.5% |
| Carousel (Multiple Images) | 1.2% – 2.0% |
| Video / Reels | 2.0% – 4.0% |
| User-Generated Content (UGC) | 2.0% – 5.0% |
| Live Content | 3.0% – 6.0% |
Engagement rates also differ by industry. For example, accounts in the creator economy and SaaS often see rates between 2.0% and 5.0%, while financial services and fintech accounts typically average just 0.3% to 1.0%. If your engagement rate is lagging behind your industry’s average, consider focusing on content that’s more likely to be saved - such as infographics, checklists, or other practical resources. Adding specific questions to your captions can also help drive more comments and interactions.
With engagement metrics covered, let’s move on to follower growth metrics to refine your strategy further.
Net follower growth gives you a clearer picture of your progress than just looking at your total followers. This is calculated by subtracting the number of followers you lose from the number you gain. For instance, if you gain 500 new followers but lose 300, your net growth is 200. That number tells the real story.
A strong Instagram growth rate usually falls between 2.5% and 5%. Keeping an eye on daily follower activity - both gains and losses - can reveal patterns. For example, if a specific post causes a sudden drop in followers, it’s likely a sign that the content didn’t resonate with your audience. Use this feedback to adjust your content strategy moving forward.
Focus on steady, organic growth rather than obsessing over daily ups and downs. A smaller, engaged audience that genuinely connects with your content is far more valuable than a large, disengaged one. Loyal followers are not just numbers - they’re the ones who buy your products, offer meaningful feedback, and promote your brand to others. Tools like UpGrow use AI to help brands grow authentically by targeting the right audience.
Once you’ve built a solid follower base, keeping them engaged becomes just as important as gaining new ones.
Retention is just as crucial as growth when it comes to building a lasting presence. High retention rates show that your content is hitting the mark, while frequent unfollows indicate it’s time to rethink your approach. Think of retention as a loyalty measure - it reflects how invested your audience is in your content.
Instagram Insights makes it easy to track both new followers and unfollows, helping you spot when and why people lose interest. For example, if a promotional video leads to a noticeable spike in unfollows, that’s a signal to tweak your future content.
Retention, like engagement, is proof that your content consistently resonates with your audience. At the end of the day, quality trumps quantity. An engaged community that interacts with your posts is far more valuable than a large but passive following. A strong retention rate shows that you’re building a loyal, active community - not just collecting numbers.
Profile interactions are a key indicator of your audience's shift from passive scrolling to active interest. These include actions like tapping your bio link, clicking on email or call buttons, or even requesting directions to your store. Each of these signals a deeper level of engagement with your business.
For example, if one post consistently drives more website clicks than others, it’s a clear sign that the content resonates with your audience and encourages action. By analyzing these trends through your automated growth report, you can refine your strategy to focus on what works best.
Click-through rate (CTR) is another critical metric, showing how effectively your profile converts visitors into website traffic. For instance, if your profile receives 1,000 visits and 50 visitors click your link, your CTR is 5%. With Instagram bios limited to just 150 characters, every word counts. Phrases like "Shop the sale" or "Download the guide" can make a big difference in driving action.
Stories also play a huge role here. With half a billion users watching Instagram Stories daily, tracking "link clicks" within Stories provides valuable insights into how your short-lived content drives traffic. Adding UTM parameters to your Story links can further help you pinpoint which campaigns lead to sales or leads.
While profile interactions highlight initial interest, tracking traffic to external platforms reveals how effectively Instagram drives tangible business outcomes. By integrating analytics tools, you can see what happens after users click through - whether they browse, sign up, or make a purchase.
Link in bio tools are especially helpful for overcoming Instagram’s single-link limitation. These tools track which specific posts generate the most traffic. For instance, you might find that your audience responds better to product announcements than behind-the-scenes content, guiding you to adjust your content strategy accordingly.
Post insights also provide valuable data. For example, if educational posts consistently drive more profile visits than promotional ones, it’s a clear sign to shift your content balance toward what your audience values most.
Finally, Instagram ads can significantly influence brand interest. In fact, 50% of users say they become more interested in a brand after seeing its ad on the platform. Whether you’re investing in paid campaigns or focusing on organic growth, the most useful metrics are those tied directly to your business goals - like website visits, store directions, and contact requests. These are the actions that ultimately impact your bottom line.
Instagram Content Format Performance Benchmarks 2026
Each content format thrives on different metrics, making it essential to measure performance in ways that fit the medium. For Stories, the completion rate is a key indicator of success. This metric shows how many viewers watched a slide all the way through. It’s calculated as:
(Impressions – Exits) / Impressions.
For multi-slide Stories, you can determine the watch-through rate by dividing the number of viewers on the final slide by the viewers on the first slide, then multiplying by 100.
Other metrics, like navigation behavior, offer deeper insights. For instance:
Interestingly, businesses account for about one-third of the most-viewed Instagram Stories, with the top 25% of active brands posting Stories at least 17 times per month.
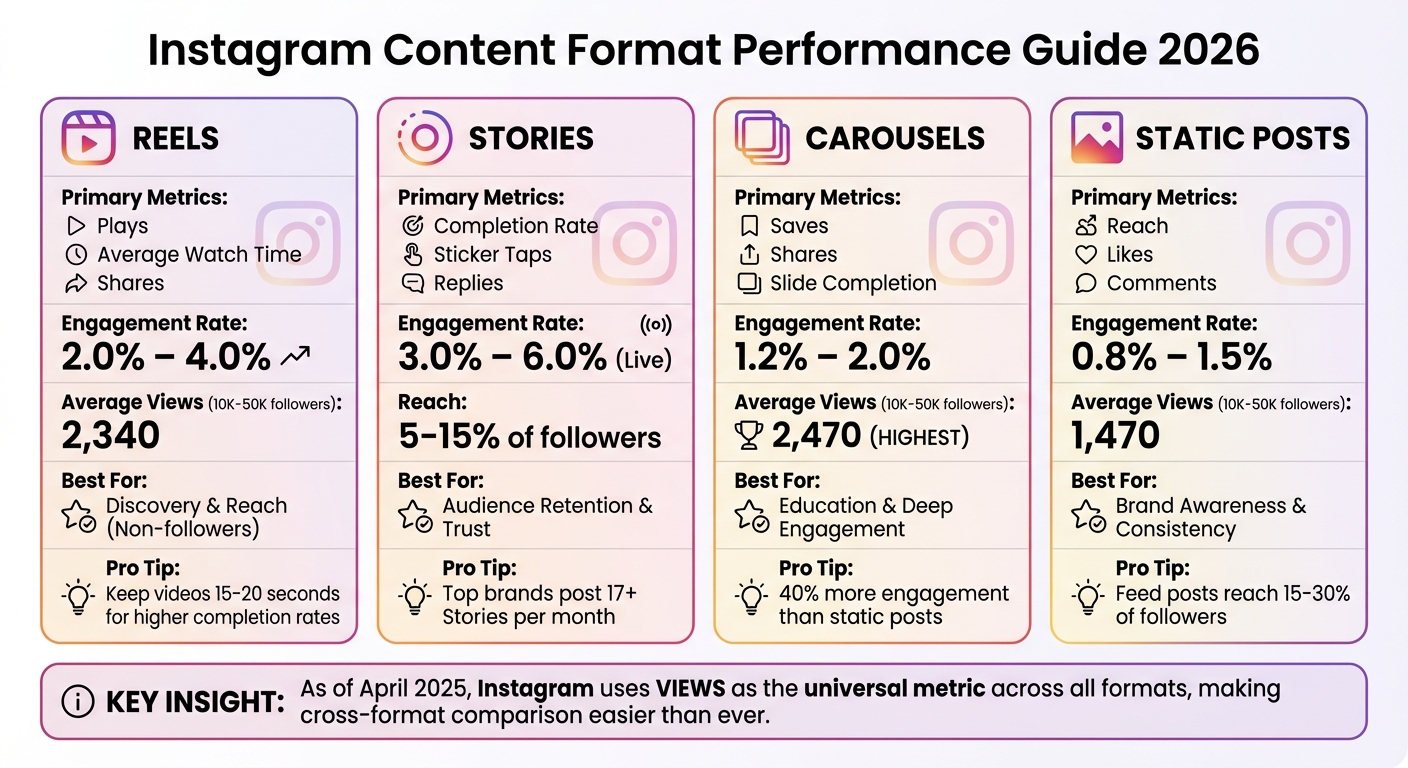
When it comes to Reels, focus on metrics like plays, average watch time, and shares per reach. Adam Mosseri, Instagram’s Head, emphasizes monitoring average watch time, the like rate compared to reach, and shares relative to reach. If your average watch time is low (around 4–8 seconds), aim for shorter videos in the 15–20-second range to boost completion rates.
Carousels, on the other hand, tend to generate the most views. For accounts with 10,000 to 50,000 followers, carousels average 2,470 views, compared to 2,340 for Reels and 1,470 for static posts. Carousels are particularly effective for saves and educational engagement, making slide-level data crucial for identifying where users lose interest.
| Content Format | Primary Success Metrics | Best For |
|---|---|---|
| Reels | Plays, Average Watch Time, Shares | Discovery & Reach (Non-followers) |
| Stories | Completion Rate, Sticker Taps, Replies | Audience Retention & Trust |
| Carousels | Saves, Shares, Slide Completion | Education & Deep Engagement |
| Static Posts | Reach, Likes, Comments | Brand Awareness & Consistency |
These metrics help you assess which formats resonate most with your audience and refine your approach accordingly.
Once you’ve analyzed performance by format, the next step is spotting patterns in your top-performing posts. Instead of recycling the same content, reuse successful structures with fresh ideas. For instance, if a “3 Mistakes” carousel performs well, apply that format to a new topic.
"Here's the thing about metrics - every post is data, even the ones that seem to flop. Instead of getting caught up in day-to-day numbers, use each post as an experiment."
- Elise Darma, Instagram Coach
Metrics like Follows from Post can reveal which content types convert viewers into followers. If your reach is strong but profile visits are low, it might mean your content hook is effective, but your profile or bio could use improvement. Educational posts often achieve broader reach compared to purely promotional ones. By categorizing your content - such as behind-the-scenes, educational, or memes - you can pinpoint which formats excel at driving saves versus shares.
As of April 2025, Instagram introduced a universal performance metric: Views. This measure applies across all formats - Reels, carousels, static posts, and Stories - making it easier to compare results and align efforts with your goals. For example:
Tools like UpGrow offer real-time dashboards to track these metrics, helping you refine your Instagram strategy and maximize impact.
Once you’ve analyzed your content’s performance and conversion patterns, the next step is understanding who your audience is and identifying the times they’re most active.
Demographics provide a clear picture of whether your content is connecting with the right people. For instance, if you’re aiming to reach millennials but notice your audience leans heavily toward Gen Z, it’s time to tweak your approach. Age plays a huge role in shaping your content’s tone, humor, and references. An audience aged 18–24 will respond to a vastly different style compared to those aged 45–54.
Gender breakdowns are also essential. Globally, Instagram’s user base is split roughly 51% female and 49% male. However, your specific audience may lean more toward one gender, which can influence everything from visual design to messaging. Similarly, location data highlights where your followers are concentrated. For example, a Spanish creator noticing a large following in Mexico might experiment with bilingual captions or regionally relevant Reels to boost engagement.
These demographic insights don’t just enhance your content - they’re key for securing impactful brand partnerships. Brands want proof that your audience aligns with their target market, and creators who actively use analytics have been shown to increase their earnings by 34% through better-aligned collaborations.
To access these detailed insights, your account needs at least 100 followers. Additionally, metrics like "Accounts Reached" or "Accounts Engaged" require interaction with over 100 accounts during the selected timeframe. Keep in mind that iOS privacy settings may limit the precision of some data, such as specific city locations, which may be estimated rather than exact.
Once you know who your audience is, the next step is figuring out when they’re most active.
Understanding when your audience engages is just as important as knowing who they are. Posting when your followers are online can significantly increase your content’s reach. Instagram’s algorithm prioritizes posts that gain early engagement, so timing your uploads strategically can give your content a much-needed boost.
Instagram now provides insights into the hours and days when your audience is most active, helping you plan posts for maximum visibility. By 2025, 76% of creators were checking their Instagram insights at least three times a week - up from 58% in 2023. This trend highlights the growing importance of real-time data. Meta’s updates in 2025 introduced AI-driven performance suggestions and live engagement alerts, making it easier to respond to audience behaviors as they happen. By 2026, updates allowed creators to track engagement in real time, enabling immediate reactions to viral moments.
The 90-day insight view is especially helpful for spotting seasonal trends, like engagement spikes during specific months, which can guide your content planning. Comparing the demographics of "Accounts Reached" with "Accounts Engaged" can also reveal which groups are simply viewing your content versus those actively interacting with it.
For a more dynamic approach, tools like UpGrow provide real-time analytics through live dashboards. These tools use AI to filter demographics like age, gender, location, and language, helping you connect with the right audience at the right time. By combining these insights with your posting schedule, you can build on the engagement and conversion patterns you’ve identified earlier.
Tracking Instagram metrics transforms raw data into practical strategies that fuel growth. Metrics like reach, impressions, engagement rates, follower retention, and audience demographics each offer valuable insights into areas ripe for improvement. As Hootsuite aptly puts it, "Knowing what works (and what doesn't) is the first step to growing your account and building an engaged following".
With these insights, the importance of data-driven decision-making has never been clearer. Instagram's algorithm now prioritizes signals like Saves and Sends over traditional Likes, as they reflect content that users find valuable enough to revisit or share. Even small tweaks to your approach can lead to meaningful progress over time.
AI-powered tools, such as UpGrow, simplify this process by automating data collection and analysis. These tools offer real-time analytics through live dashboards and advanced targeting filters, helping you connect with the right audience based on factors like age, gender, location, and language. As Sprout Social highlights, "AI-powered analytics will free up valuable time for you to make smarter, more strategic decisions without getting bogged down by tedious data mining". This allows you to dedicate more energy to creating compelling content.
Regularly reviewing your metrics is key. Frequent evaluations can uncover opportunities for quick adjustments, ensuring your strategy stays agile. By combining the metrics discussed in this guide with the efficiency of AI-driven tools, you can focus on what truly matters: crafting content that resonates and building a deeply engaged community.
To grow on Instagram, it's crucial to track key metrics like engagement rate, follower growth, reach, impressions, saves, shares, story and reel performance, and profile actions. These numbers reveal how your audience responds to your content and provide insights to refine your strategy for improved outcomes.
Calculating engagement rate based on reach provides a clearer picture of how effectively your content connects with its audience. Instead of relying on follower count, which can include inactive or irrelevant users, this method focuses on the number of unique viewers who actually see and interact with your content. It’s a more precise way to gauge real audience engagement.
Take time each month to review your Instagram growth report. This regular check-in helps you spot trends, refine your approach, and keep your growth steady. By analyzing the data, you can see what’s working and make smarter, informed adjustments to improve your results.


