Top 7 Profile Reporting Tools for Instagram
Compare seven Instagram profile reporting tools with features, pricing, and use cases to find the best fit for creators, teams, or agencies.
Compare seven Instagram profile reporting tools with features, pricing, and use cases to find the best fit for creators, teams, or agencies.
4.98 /5 - from 58k reviews
Trusted by 50,000+ creators — get real engagement delivered to your profile in minutes, not days.

Running a successful Instagram account in 2026 requires more than just posting content. To grow, you need data-driven insights to understand what works and what doesn’t. Instagram's native analytics are helpful but limited to 90 days of data. That’s where third-party reporting tools come in, offering long-term data storage, competitor analysis, and custom dashboards.
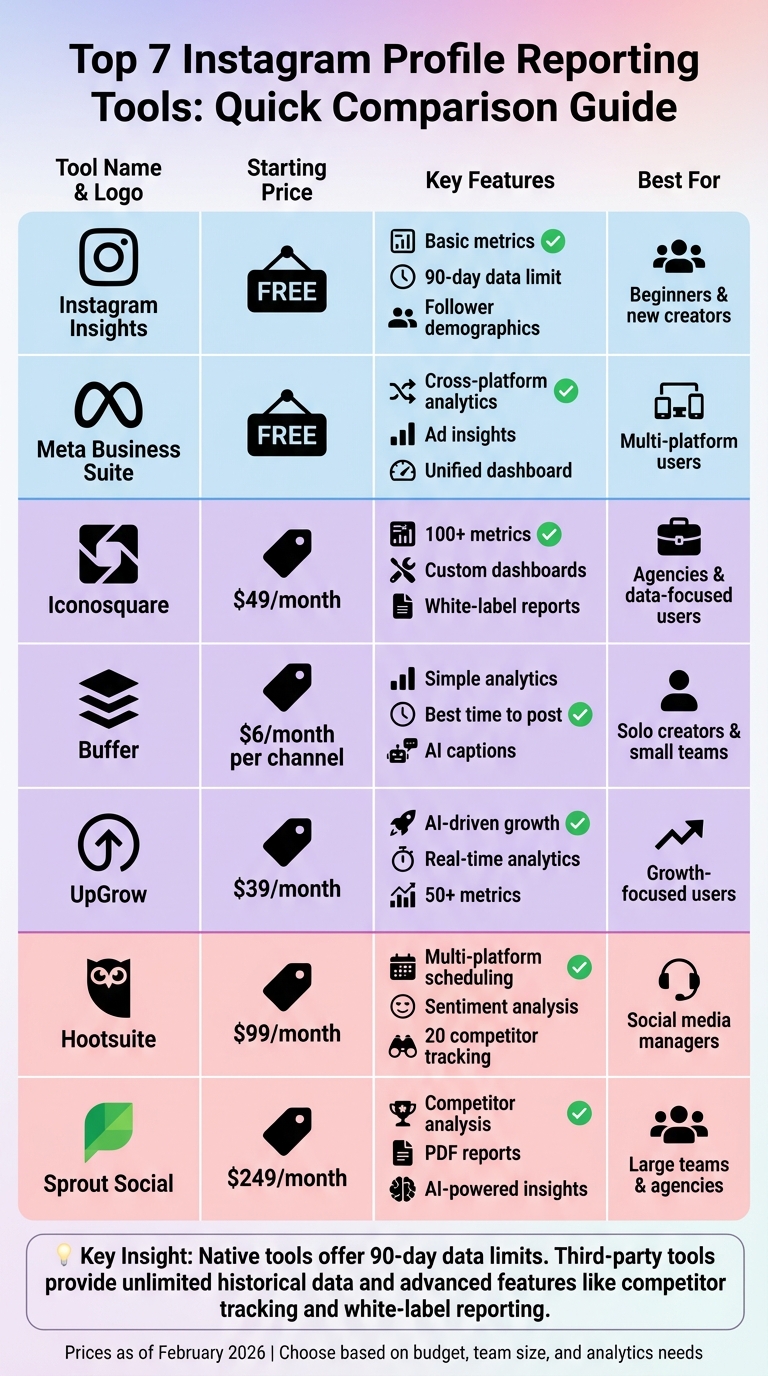
Here’s a quick breakdown of the best Instagram profile reporting tools:
| Tool | Starting Price | Key Features | Ideal For |
|---|---|---|---|
| Instagram Insights | Free | Basic metrics, 90-day limit | Beginners |
| Meta Business Suite | Free | Cross-platform, ad insights | Multi-platform users |
| Sprout Social | $249/month | Competitor analysis, PDF reports | Large teams, agencies |
| Iconosquare | $49/month | Custom dashboards, client reporting | Agencies, data-focused users |
| Hootsuite | $99/month | Multi-platform, scheduling tools | Social media managers |
| Buffer | $6/month | Simple analytics, posting tips | Solo creators, small teams |
| UpGrow | $39/month | AI-driven growth, real-time data | Growth-focused users, small businesses |
These tools cater to different needs - whether you’re a solo creator looking for affordable options or a business needing advanced analytics. Choose based on your goals, budget, and the level of insights you require.
Instagram Profile Reporting Tools Comparison: Features and Pricing Guide 2026
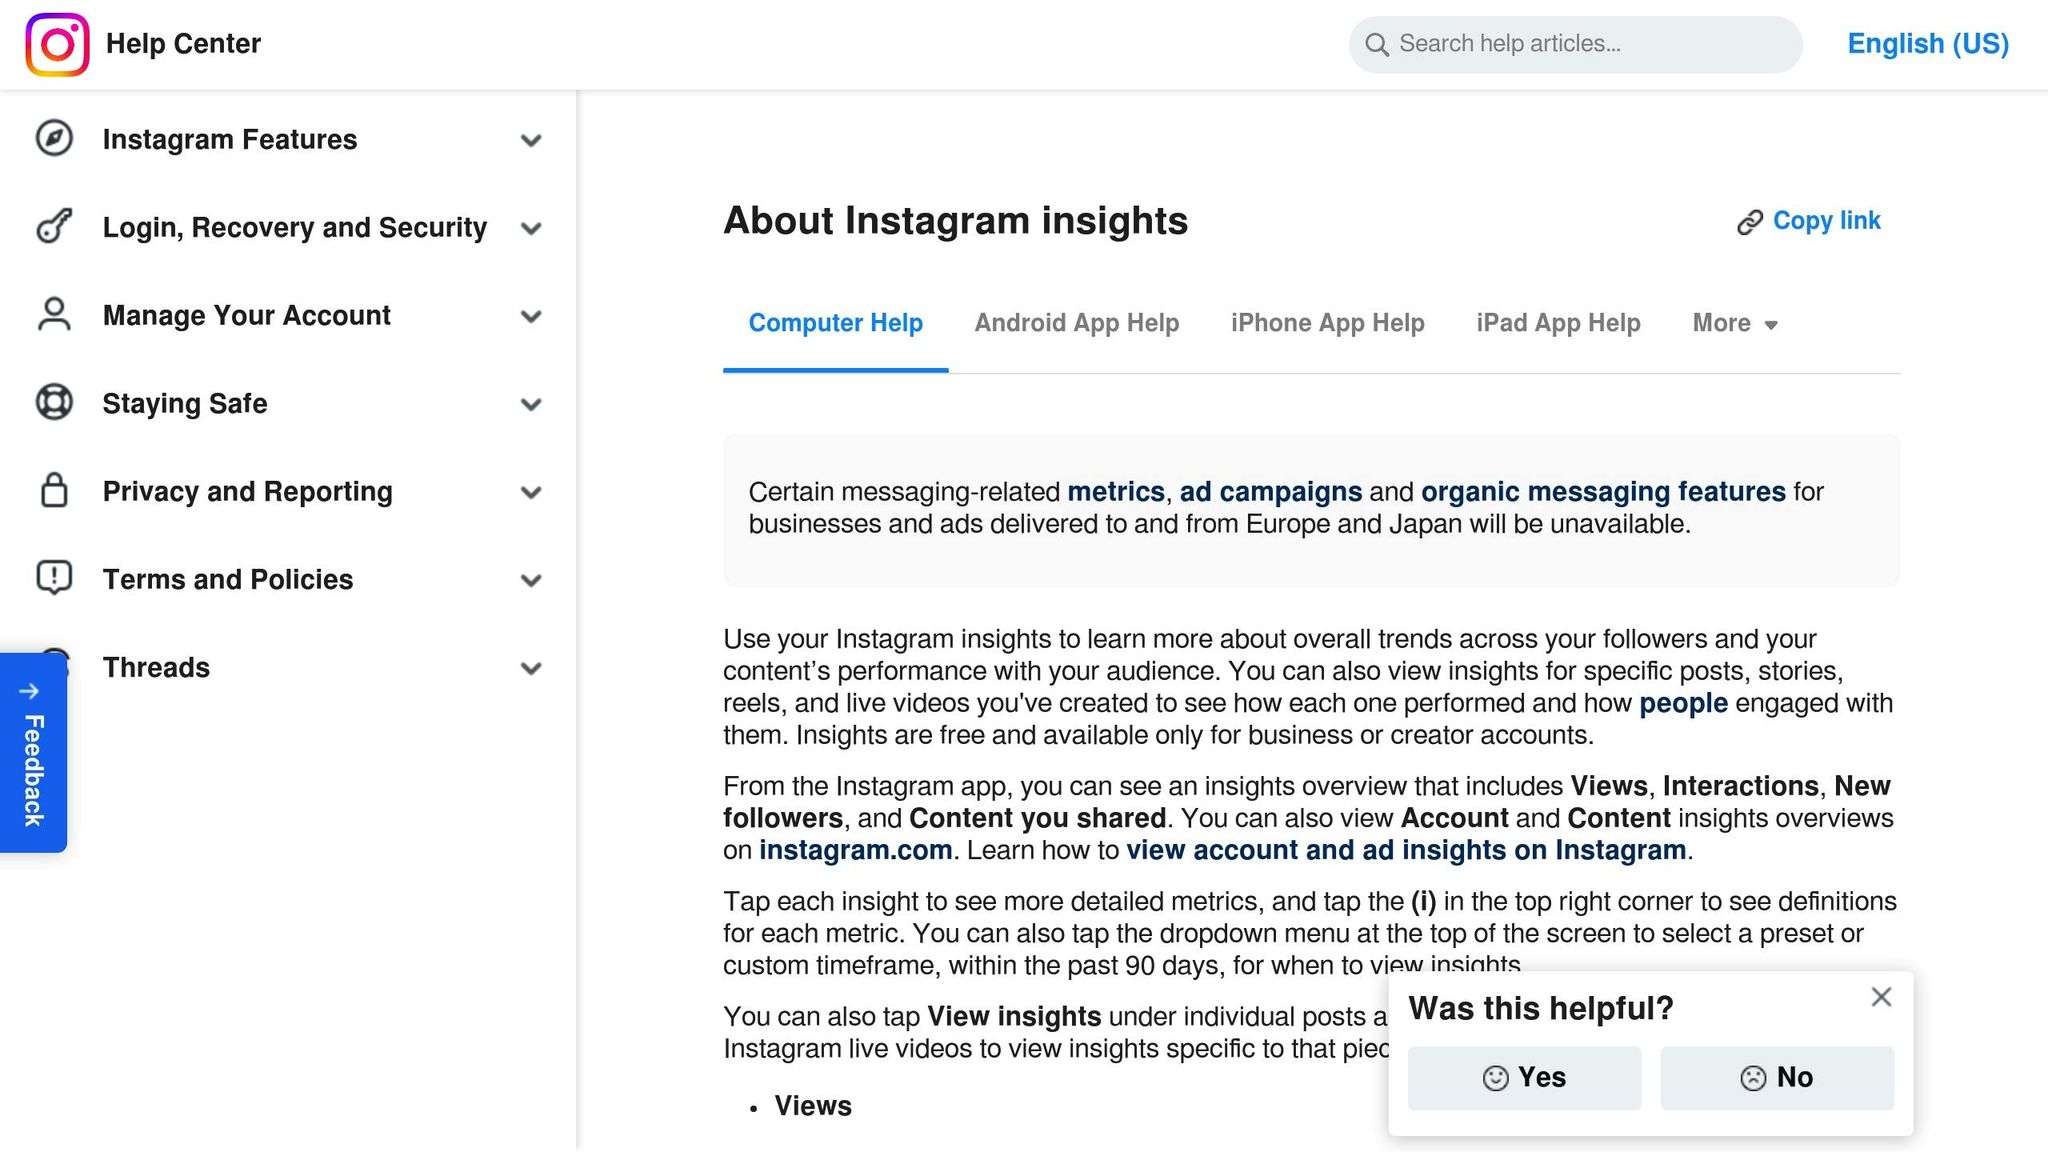
Instagram Insights is a free analytics tool provided by Instagram, designed specifically for Business and Creator accounts. You can access it through the Instagram mobile app or Meta Business Suite. This tool gives you an overview of your profile’s performance, with interactive metrics and detailed charts to help you analyze your data. It’s a great first step in understanding your account’s performance before moving on to more advanced analytics platforms.
Instagram Insights allows you to view data for preset periods (7, 30, or 90 days) or a custom range within 90 days. If you need to track trends over a longer period, you’ll have to manually export the data. Insights for Stories are available for only 24 hours unless you access them through the Stories archive. The Content Library feature lets you filter your shared content - such as posts, Stories, Reels, and live videos - by media type, reach, or interactions, making it easier to identify which content performs best.
The tool focuses on four key areas: Accounts Reached, Accounts Engaged, Total Followers, and Content You Shared. It tracks follower growth (gains and losses), audience demographics (like top cities, countries, age ranges, and gender), and interaction metrics, such as likes, comments, saves, and shares. In the Total Followers section, you can see when your audience is most active, which can help you plan your posting schedule. However, demographic data only becomes available once you’ve reached at least 100 followers or unique accounts.
For promoted content, Instagram Insights provides ad-related data, including results tied to your campaign goals, cost per goal, and total spend. The Accounts Engaged metric also breaks down engagement between followers and non-followers. To help users understand the data, most screens include an information icon that defines each metric.
Instagram Insights is entirely free for professional accounts. It offers real-time data across all content types, making it a valuable tool for understanding your performance. However, it lacks features like competitor benchmarking and access to unlimited historical data - features that are often available in third-party tools. As Sprout Social points out:
Instagram Insights equips you with the performance data you need to understand what resonates and why.
This makes it an excellent starting point for analyzing your profile, especially since it comes at no cost. But for those who need deeper insights, additional tools may be necessary, as discussed later in this article.
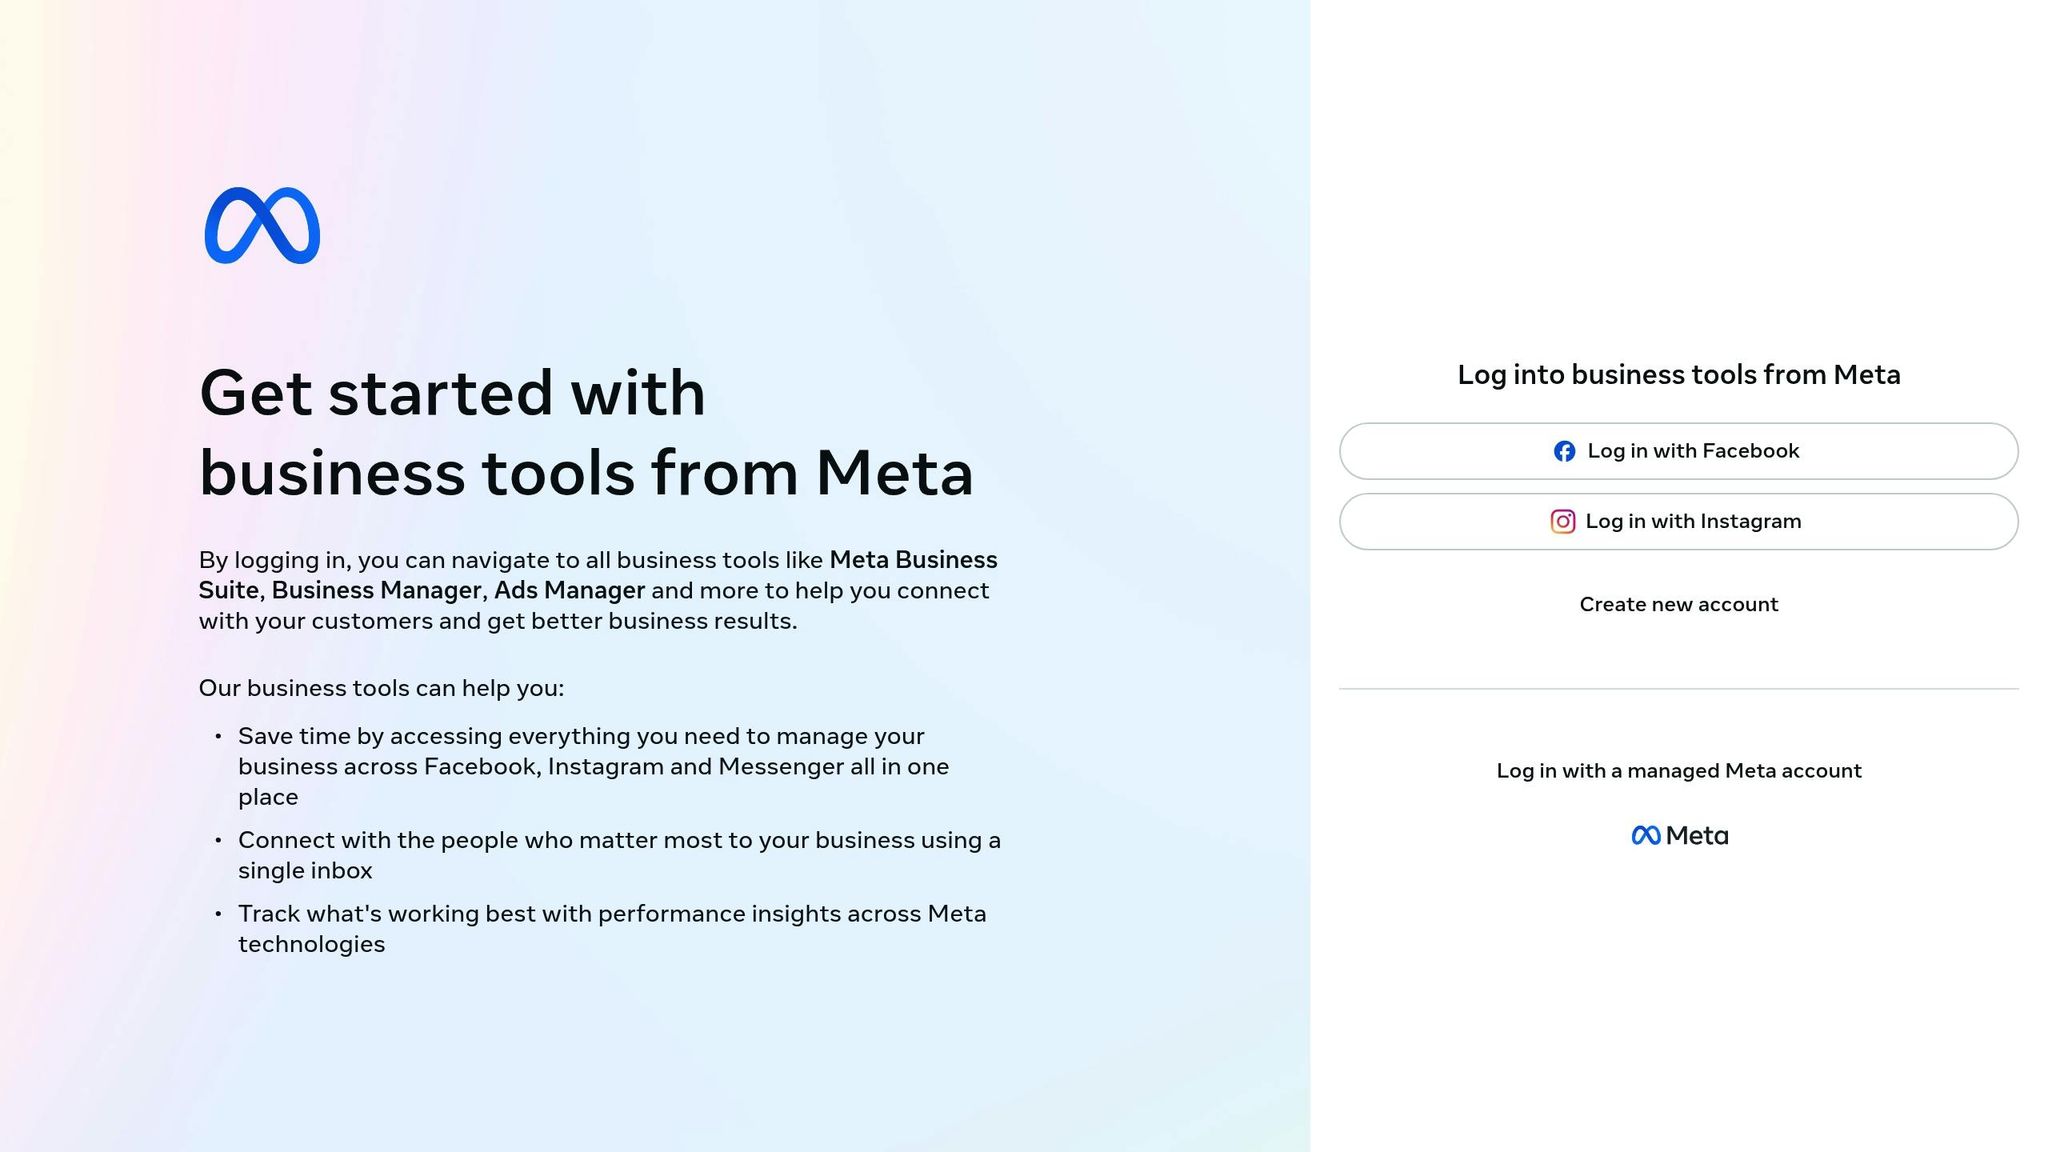
If you're looking for something beyond Instagram's basic analytics, Meta Business Suite Insights might be the perfect fit. This free tool, available on both desktop and mobile, acts as a central hub for managing analytics across Instagram and Facebook. It builds upon Instagram's native features, offering a more streamlined and comprehensive experience - especially handy if you're juggling multiple social media accounts. With its enhanced interface, sharing reports and managing cross-platform engagement becomes much simpler.
Meta Business Suite organizes its data into four main dashboard sections: Overview, Content, Audience, and Reach. You can analyze data over customizable timeframes, including 7, 14, 30, or 90 days, and export reports in formats like CSV, PNG, or PDF. This makes it easy to share performance insights with your team or clients. For paid campaigns, the platform takes things a step further with pre-built ad report templates and automated report scheduling. You can set up daily, weekly, or monthly email deliveries for added convenience.
The platform doesn't stop at basic reporting - it dives deeper into audience and campaign data. You can explore advanced breakdowns of your audience's demographics, including age, gender, location, and even the times they’re most active. For ad campaigns, it offers detailed metrics like Click-Through Rate (CTR) and Cost Per Click (CPC), helping you assess how effectively your budget is being used.
Meta Business Suite does more than just analytics. It also includes tools for content scheduling and unified messaging across Instagram and Facebook. This cross-platform view is incredibly useful for campaigns running on both platforms, allowing you to compare performance side-by-side and spot trends more easily.
The best part? Meta Business Suite Insights is completely free for all Business and Creator accounts. As noted by Statusbrew:
Meta Business Suite offers a more unified view (cross-platform with Facebook) and easier exporting, but the underlying Instagram data limits are identical.
What sets it apart is the convenience factor: a larger screen, better export options, and seamless cross-platform management - all without spending a dime.
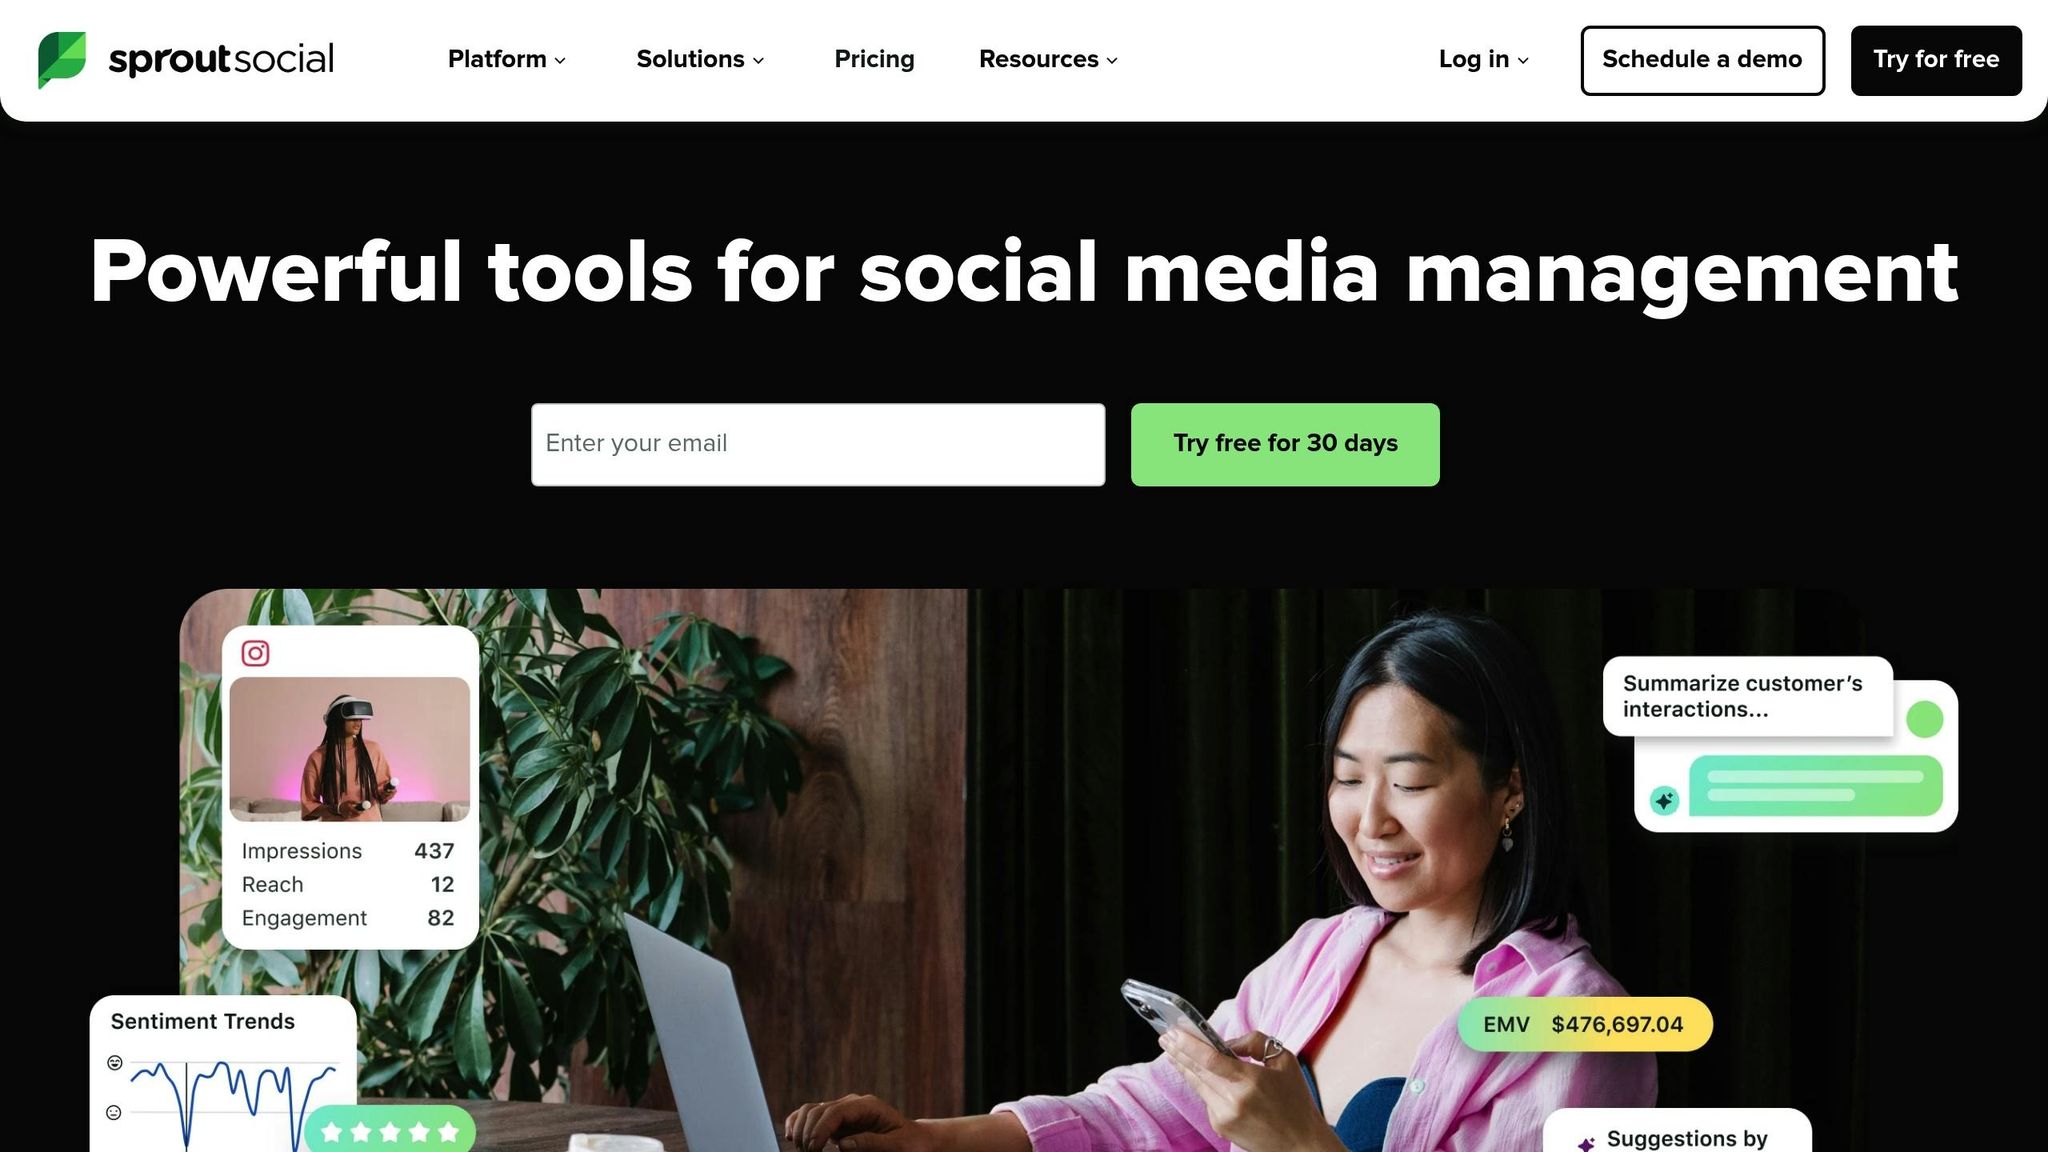
Sprout Social takes Instagram reporting up a notch by offering a centralized and comprehensive analytics platform. Whether you're juggling multiple profiles or managing both organic and paid campaigns, this tool brings all your Instagram data into one interactive dashboard. It provides detailed insights into Story performance, engagement trends, and campaign metrics, making it an excellent choice for marketers who need clarity and depth.
Sprout Social stands out for its reporting features. It lets you create white-label PDF reports tailored for stakeholders, while also offering CSV exports with up to 50 columns of detailed information. These exports can break down data by day, network, or profile, giving you flexibility in how you analyze the numbers. To save time, you can schedule reports for automatic delivery. Customization options are robust - you can select specific profiles, set custom date ranges, and even tag campaigns for easier tracking. For those with Premium Analytics, there's an added perk: the ability to compare non-contiguous date ranges, helping you benchmark performance over time.
The platform covers all the key Instagram metrics. You can track follower growth (including net changes that account for unfollows), total engagements (likes, comments, saves, and story replies), as well as impressions and reach for both organic and paid content. Sprout Social also dives into audience demographics, breaking down followers by age, gender, and location - even pinpointing specific cities and countries. One standout feature is the Instagram Competitors Report, which allows you to monitor public Instagram Business Profiles. This report compares follower growth, engagement rates, and posting frequency. Plus, you can see the top three hashtags your competitors use, ranked by total engagement.
Sprout Social goes beyond traditional analytics. It includes AI-powered tools like caption generation and social listening to identify trending topics. Its AI-driven Smart Inbox helps prioritize engagements, ensuring you stay on top of what matters most. Clayton Norman, Social Media and Digital Marketing Leader at Indiana University, highlights the tool's value:
"In the past, people valued social and certainly were willing to invest in Sprout with us, but more and more the university has become invested in our team, the data and analytics we provide."
You can try Sprout Social for free with a 30-day trial - no credit card required. After that, subscription plans scale to suit businesses of different sizes, from smaller operations to large enterprises. For those who need even deeper insights and advanced visualizations, the Premium Analytics package is available. While some users note that it's "quite a bit more expensive than Hootsuite", many feel the extensive feature set justifies the cost.
Next, we'll take a closer look at Iconosquare and how it approaches profile analytics.
Iconosquare gives marketers the tools they need to take control of Instagram data visualization. With access to over 100 real-time metrics, it’s perfect for those who want to move beyond spreadsheets and dive into detailed performance insights. In 2024, over 10,000 brands and agencies relied on Iconosquare, which generated an impressive 65 billion impressions and achieved a 98% customer satisfaction rate. It’s a step up from earlier tools, offering advanced customization and reporting features.
Iconosquare’s drag-and-drop dashboard makes it easy to organize charts, graphs, and metrics exactly how you want them. The "Groups" feature is particularly useful for those managing multiple Instagram accounts for a single brand or client. Reports are customizable and can be exported as PDFs or Excel files, with the option to schedule them daily, weekly, monthly, quarterly, or yearly. On the Excel plan, users can even white-label reports by removing Iconosquare branding and adding their own logos.
Joseph D., Founder & Owner at NJ Center for Laser & Cosmetic Dentistry, shares:
"Iconosquare allows us to better understand our social media performance by providing a clear comprehensive dashboard for different metrics. You can either get an overview of top indicators or get deep into the analytics with precise data points."
Iconosquare tracks all the key metrics you’d expect, including follower growth, engagement rates (likes, comments, saves, shares), reach, and impressions. It also dives deeper with Reels-specific data like total watch time, replays, and follows, along with detailed Story analytics that reveal completion and retention rates (a strong retention rate hovers around 70%). Additionally, audience demographics such as age, gender, and location are available, alongside profile activity metrics like bio link taps and profile views. For those keeping an eye on competitors, the benchmarking tool compares engagement, posting frequency, and audience growth with public accounts.
Iconosquare isn’t just about analytics. It also includes AI-powered tools for writing captions and brainstorming content ideas. The platform recommends optimal posting times based on historical performance and offers a social listening feature to track hashtag performance and brand mentions in captions and comments. For a quick analysis, the free Instagram Audit tool identifies areas where your account could improve.
Jolien H., Social & Community Executive at Paula's Choice, highlights:
"The scheduler is super easy, with just a few steps I can plan my content. But what I find best of all is the entire analytics section & the individual dashboards, which makes any reporting super easy."
Iconosquare provides a free plan for up to two profiles with basic analytics and a 14-day free trial for its paid plans - no credit card required. The Launch plan starts at $33 per month (billed yearly) for five profiles and one user. The Scale plan, priced at $69 per month, adds social listening and accommodates three users. For $116 per month, the Excel plan includes white-label reporting, six user accounts, and unlimited data retention. Agencies managing 20 or more profiles can request custom pricing.
With its detailed analytics and customization options, Iconosquare sets the stage for a closer look at how Hootsuite handles Instagram profile reporting next.
Hootsuite has been in the game for 17 years, serving 25 million users worldwide - a testament to its reliability as an Instagram reporting platform. It’s a tool that helps digital teams cut their management workload by half, while Instagram Enterprise users have reported up to 500% growth across their social channels. With such a strong track record, Hootsuite provides a dashboard that simplifies even the most complex data.
Hootsuite’s unified analytics dashboard makes data easy to digest with colorful graphs, sentiment tracking charts, and donut charts. Whether you need custom reports or prefer pre-built templates, the platform covers metrics like engagement, audience insights, and post performance. You can also schedule reports for automatic delivery and export them in multiple formats to share with stakeholders. Its drag-and-drop content calendar offers a clear, visual way to manage your Instagram posting schedule across all your linked social platforms.
Jose V., Project Manager at Chauvet Lighting, shares his experience:
"Hootsuite makes it incredibly easy to schedule, manage, and monitor posts across multiple brands and platforms... Its user-friendly dashboard and analytics help our team stay on top of everything."
Hootsuite provides detailed tracking of profile-specific metrics, including follower growth, profile visits, website clicks, daily engagements, and even negative feedback. You’ll find engagement details like clicks, comments, reach, impressions, shares, saves, video views, and more. For deeper audience insights, the Panoramiq Insights integration offers demographic data such as age, gender, and location - all accessible directly within the dashboard. Keep in mind that Instagram metrics typically refresh every 48 to 64 hours.
Hootsuite goes beyond basic analytics with tools designed to boost your social media strategy. The Best Time to Publish feature analyzes historical data to recommend the optimal posting times. There’s also OwlyGPT, an AI assistant that helps generate captions and hashtags aligned with your brand. Competitive benchmarking allows you to monitor up to 20 competitors, comparing their follower growth, posting frequency, and engagement rates side by side. Additionally, real-time social listening streams keep tabs on brand mentions and competitor activity, helping you stay ahead of the curve.
Hootsuite offers a 30-day free trial to get you started. The Standard plan costs $175/month (billed annually) and supports one user with up to 10 social accounts. For $373/month, the Advanced plan includes unlimited social accounts and additional user access. Enterprise plans, designed for teams of five or more, feature custom pricing and advanced capabilities like ROI reporting and Talkwalker-powered social listening. Annual plans come with a 10% discount if you choose to skip the trial.
Buffer, trusted by more than 190,000 creators and businesses each month, combines Instagram reporting with tools for managing multiple social media platforms. However, it's important to note that Buffer is designed specifically for Instagram Business accounts - personal profiles won't have access to its advanced features.
Buffer's dashboard pulls together performance data from Instagram, Facebook, X (formerly Twitter), and LinkedIn, making it easier to compare organic posts with boosted content. This feature is especially useful for evaluating your return on ad spend. With the custom report builder, you can select specific metrics and charts to focus on, and reports update automatically every day. However, the dashboard itself refreshes every 24 hours.
"The efficiency of analytics reporting means that we can take learnings and adapt our future content to reflect those learnings".
Custom reports can be exported as PDFs or image files, making it simple to share insights with your team or stakeholders.
Buffer tracks a wide range of metrics to help you understand your audience and content performance. These include follower growth (follows and unfollows), engagement rates, reach, impressions, and daily clicks. It also provides a detailed breakdown of audience demographics, such as age, gender, and location - even down to the city level. On the engagement side, the platform tracks likes, comments, shares, saves, profile visits, and bio link clicks. Since Buffer relies on Instagram's official API, the data it provides aligns with Instagram's definitions for metrics like reach and impressions.
Buffer offers practical recommendations to fine-tune your social media strategy. For example, its "Best Time to Post" analysis uses your historical performance to suggest optimal posting times. The "Answers" report highlights which content formats - like Reels or carousels - and posting frequencies are driving the most growth. Additionally, Buffer integrates analytics with features like AI-powered caption refinement and a centralized dashboard for managing comments. This combination can help increase engagement by up to 21%.
Buffer provides a free plan with basic analytics, while its paid plans start at $6 per month per channel. Upgrading to a paid plan unlocks the full "Analyze" dashboard, custom-branded reports, detailed audience demographics, and "Best Time to Post" insights. There's also a 14-day free trial available, and you won’t need a credit card to sign up. Once you connect your Instagram account, Buffer backfills a limited amount of historical data and begins tracking all metrics moving forward.
Buffer's detailed analytics and actionable insights make it a strong contender for anyone looking to elevate their social media strategy. Next, we’ll take a closer look at another tool to see how it compares.
UpGrow blends AI-driven growth services with in-depth profile reporting, offering clear insights into how AI-powered targeting can boost follower growth and engagement. Since its debut in 2016, the platform has helped more than 100,000 Instagram users grow their accounts organically, earning an impressive 4.98/5 rating from over 58,000 reviews. What makes UpGrow stand out is its seamless combination of real-time analytics and a powerful growth engine.
UpGrow’s live dashboard tracks over 50 metrics, utilizing GPT-o3 AI for hourly growth updates and real-time follower counts. It allows users to monitor historical trends, identify peak engagement times, and analyze precise follower gains or losses. The platform also includes an unfollow detection tool that sends instant alerts, helping users quickly identify if a post or content tweak is causing audience shifts. Plus, all the data can be exported as downloadable PDF reports for easy sharing.
The platform covers essential Instagram metrics like follower growth, engagement rates, and content performance. It also dives deeper into audience demographics, including age, gender, location, and language preferences. With its AI-targeting filters, users can see how adjustments to targeting settings - like focusing on specific locations or niche interests - impact follower quality and retention in real time. Early users of the UpGrow Boost™ feature reported a 275% increase in monthly followers, showcasing the potential of precise targeting.
"UpGrow is the secret to growing your Instagram following fast! In just one month, I gained over 4,000 real followers - it's been a total game-changer for my fitness account." - Oliver1962
This kind of feedback highlights the platform’s ability to combine advanced analytics with practical growth solutions.
UpGrow offers a free starter option, giving users access to 23 AI-powered tools already trusted by over 2.4 million people worldwide. Paid plans begin at $39 per month, with a current 60% discount available as of February 2026. Agencies managing multiple accounts can take advantage of bulk discounts, and the platform backs its service with a growth guarantee - if you don’t see results, you get your money back, no questions asked. For those seeking to merge organic growth strategies with detailed tracking, UpGrow provides a well-rounded and reliable solution.
Here’s a quick look at the key features and pricing for each tool to help you decide which one fits your needs. Whether you’re a beginner looking for free options or a pro team needing advanced analytics, this table breaks down the essentials.
| Tool | Starting Price | Key Visualizations | Profile Metrics | Ideal For |
|---|---|---|---|---|
| Instagram Insights | Free | Basic bar and pie charts, Reel retention graphs | Follower demographics, reach, engagement (90-day historical data) | New creators and small businesses needing quick daily feedback |
| Meta Business Suite | Free | Cross-platform dashboards displaying organic and paid metrics | Unified Facebook and Instagram profile data (90-day historical data) | Brands managing both Facebook and Instagram without a subscription |
| Sprout Social | $249/user/month | Interactive charts and PDF reports | Multi-brand governance and cross-network workflows | Mid-market and enterprise teams requiring deep reporting |
| Iconosquare | ~$49/month | Over 100 customizable metrics with widget-based dashboards and one-click exports | Competitor benchmarking and automated PDF summaries | Agencies and data-driven brands focused on client reporting |
| Hootsuite | $99/month | Unified dashboards with sentiment analysis | Multi-platform analytics and brand perception tracking | Social media teams consolidating scheduling and analytics |
| Buffer | $6/month per channel | Clean dashboards paired with a visual grid planner | Simple engagement metrics and recommendations for the best time to post on Instagram | Solo creators and lean teams seeking affordable, easy-to-use analytics |
| UpGrow | $39/month | Live dashboard with real-time analytics and downloadable PDF reports | Follower growth, engagement, and audience demographics | Users combining organic Instagram growth strategies with real-time tracking and AI-powered targeting |
Key Takeaways:
This guide simplifies your decision-making by highlighting which tool best matches your budget, team size, and analytics needs.
Picking the right profile reporting tool can turn your Instagram strategy into a precise, data-driven plan. The tools mentioned here help uncover which content formats expand your reach, when your audience is most engaged, and which hooks keep them coming back. As Matt Moran, Lead Technical Writer at Blogging Wizard, aptly says:
"If you're still guessing what's working on Instagram, you're throwing money at the wall and hoping it sticks".
For those just starting out, free tools like Instagram Insights or Meta Business Suite are a great starting point. But as your needs grow - whether it's tracking historical data, analyzing competitors, or automating client reports - more advanced tools can step in to fill the gaps. Solo creators might lean toward budget-friendly, visually intuitive platforms, while agencies often need features like white-label reporting and multi-client dashboards. If your goal is to blend organic growth with real-time analytics, tools like UpGrow offer AI-powered targeting alongside detailed performance tracking and Instagram SEO.
Shifting your focus to metrics like saves and shares, rather than just likes, can boost your content's visibility in the algorithm. Regular audits also protect your brand by spotting fake followers - an issue that can lead to conversion rates dropping by as much as 58% in campaigns with inflated follower counts. Additionally, brands using audit tools have reported cutting wasted marketing spend by 67% in Q1 2024.
Refer to the comparison table to balance your budget, team size, and analytics needs. The right tool transforms your raw data into actionable strategies that drive results.
To grow on Instagram, you’ll want to keep an eye on key metrics like engagement rate (likes, comments, and shares), reach, impressions, follower growth, and audience demographics (age, gender, and location). Among these, engagement rate stands out - it shows how much your content connects with your audience, which directly affects how visible your posts are and how much your account grows.
By regularly tracking these numbers, you can fine-tune your content strategy, boost engagement, and create posts that align with what your followers actually want to see. This approach helps you grow your account naturally and build a stronger connection with your audience.
To retain Instagram analytics beyond the 90-day limit, take advantage of Instagram’s built-in export tools or use third-party platforms. Exporting your data ensures you can analyze trends over extended periods, offering insights that cover months or even years. Opt for tools that support CSV exports or offer comprehensive reporting features to keep your historical data accessible and organized.
To find the best reporting tool for your needs, think about both your budget and what features you require. If you're working with a smaller budget, tools like Instagram Insights or Metricool offer basic analytics at an affordable price. For those who need more advanced options - like automation or multi-channel reporting - there are tools available starting at around $20 per month. A good approach is to begin with free or low-cost tools to evaluate your requirements before committing to a more feature-packed solution.


